Spectra of random graphs
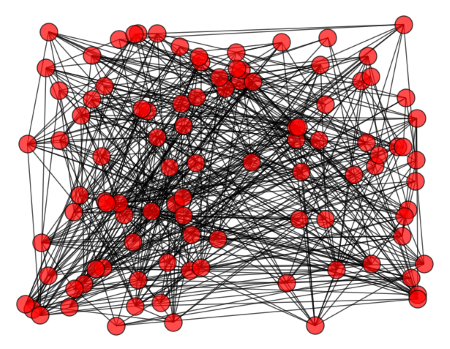
Create a graph by first making a set of n vertices and then connecting nodes i and j, i > j, with probability p. This is known as the ErdAs-Ri(C)nyi graph Gn,p. Here's such a graph with n = 100 and p = 0.1.

Then the spectrum of the adjacency matrix A of the graph bounces around the spectrum of the expected value of A. This post will illustrate this to give an idea how close the two spectra are.
The adjacency matrix A for our random graph has zeros along the diagonal because the model doesn't allow loops connecting a vertex with itself. The rest of the entries are 1 with probability p and 0 with probability 1-p. The entries above the diagonal are independent of each other, but the entries below the diagonal are determined by the entries above by symmetry. (An edge between i and j is also an edge between j and i.)
The expected value of A is a matrix with 0's along the diagonal and p's everywhere else. This matrix has one eigenvalue of p(n - 1) and (n - 1) eigenvalues -p. Let's see how close the spectra of a dozen random graphs come the spectra of the expected adjacency matrix. As above, n = 100 and p = 0.1.

Because the eigenvalues are close together, I jittered each sample horizontally to make the values easier to see. Notice that the largest eigenvalue in each sample is around 10. The expected value is p(n - 1) = 9.9, so the values are close to their expected value.
The other eigenvalues seem to be centered around 0. This is consistent with the expected value of -p = -0.1. The most obvious thing about the smaller eigenvalues is not their mean but their range. How far can might the eigenvalues be from their expected value? Fan Chung and Mary Radcliffe give the following estimate in their paper On the Spectra of General Random Graphs.
For Gn,p, if p > 8 log(a2 n)/9n, then with probability at least 1 - 1/n we have
Here J is the matrix of all 1's and I is the identity matrix. In our case the theorem says that with probability at least 0.99, we expect the eigenvalues of our random graph to be within 19.903 of their expected value. This is a pessimistic bound since no value is much more than 5 away from its expected value.
