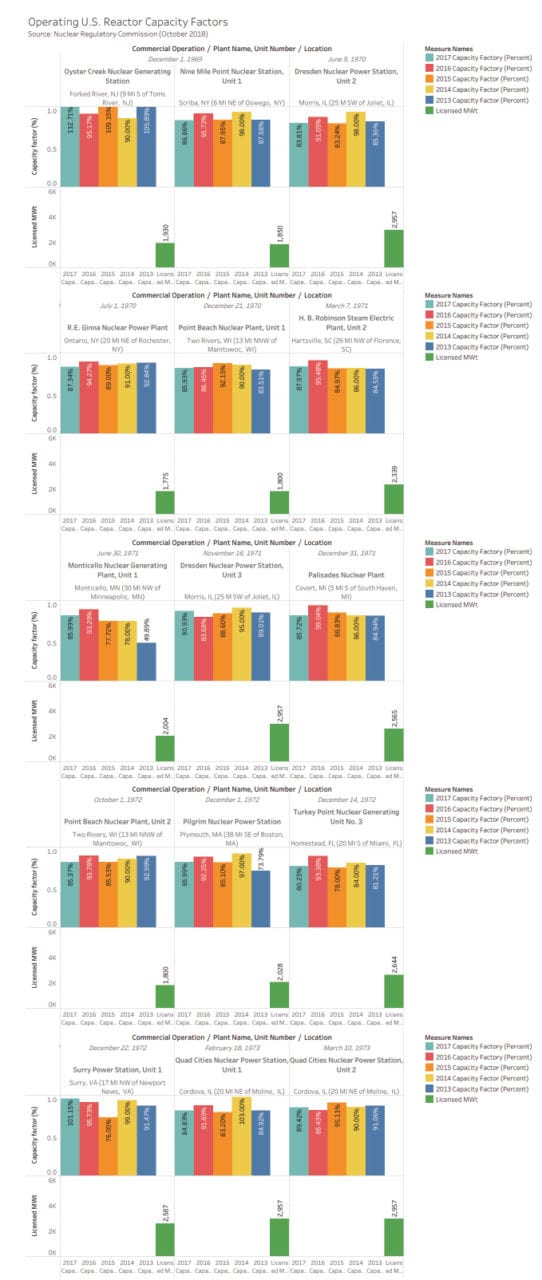
How Efficiently Have U.S. Nuclear Reactors Operated Over the Past Five Years? [INFOGRAPHICS]
According to the Nuclear Regulatory Commission (NRC), the nation's 99 operating nuclear reactors operated at an average capacity factor of 88% in 2017-the same as in 2016-despite market forces that have rendered several units uneconomical. Figures for 2018 are expected in 2019 and may look different. Oyster Creek Nuclear Station, for example, was permanently closed in September 2018, though it operated beyond its designed capacity in 2017.
The NRC defines capacity factor as the "ratio of the net electricity generated, for the time considered, to the energy that could have been generated at continuous full-power operation during the same period." Capacity factor figures shown here, for example, are calculated by dividing the actual net electrical energy produced by the total "possible" electrical energy (based on operating at the nameplate capacity) over a year.
Asked why some units' capacity factors exceed 100%, an NRC spokesperson told POWER "a unit's actual electrical capacity varies during the year because temperature variations in cooling water affect the unit's thermal efficiency. So even though the unit has a nameplate capacity, there are times when the actual output capacity is above or below the nameplate capacity. If a unit operates at or near full capacity during the entire year and the temperature conditions are right, this can lead to cases where the electrical output was greater than the output if the unit operated at nameplate capacity the entire year."
For example, DC Cook 2 produced 10,332,093 MWh in 2017 though it has a nameplate capacity 1,133 MW. (1,133 MW x 365 days x 24 hours = 9,925,080 MWh.) "Using these values in the formula above yields a 104% capacity factor, which is the value in the spreadsheet," he said.

(Click for the full infographic)
An interactive version of this infographic can be accessed using the link below. (Note: With cursor on the graphic, swipe left on the visualization to access additional plants' information.) https://public.tableau.com/views/OperatingU_S_ReactorCapacityFactors/Sheet1
-Sonal Patelis a POWER associate editor (@sonalcpatel, @POWERmagazine)

The post How Efficiently Have U.S. Nuclear Reactors Operated Over the Past Five Years? [INFOGRAPHICS] appeared first on POWER Magazine.
