An Animated Map Showing Urban Growth in the Five Boroughs of New York City From 1609 to Present Day

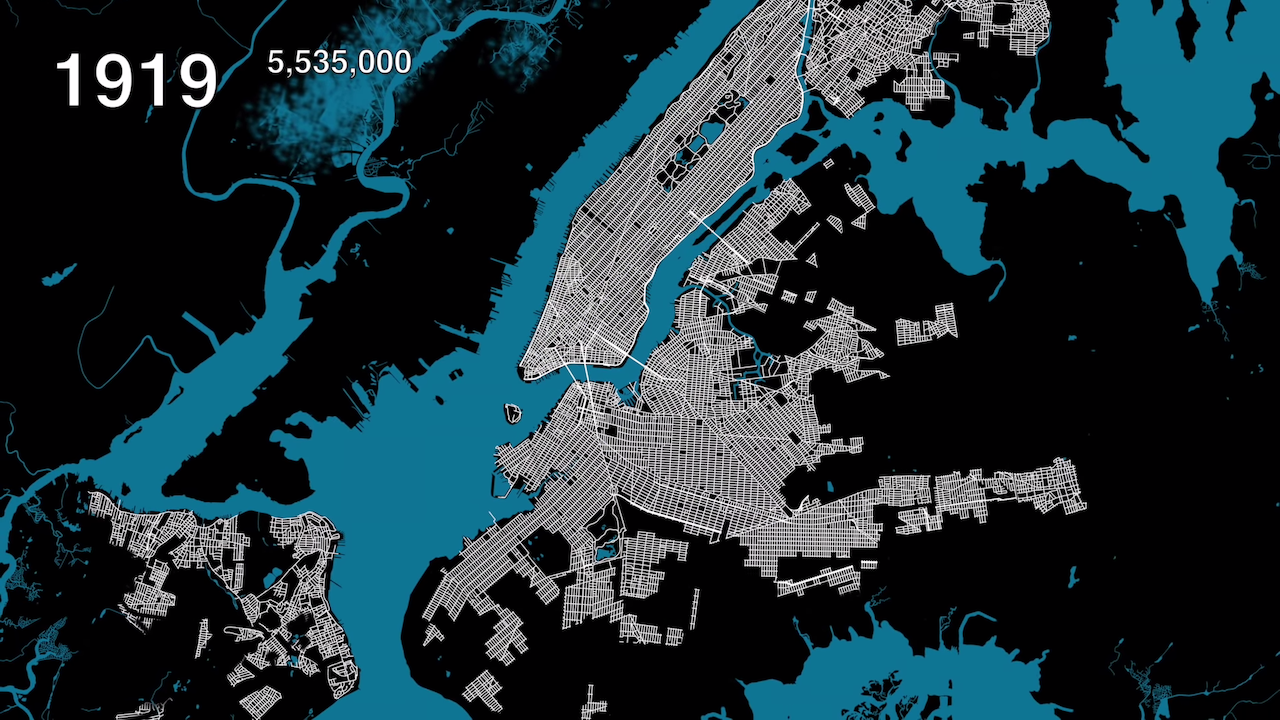
Newark native and Columbia University student Myles Zhang has created "Here Grows New York City", a really informative animated map showing the vast urban growth that took place within New York City and its surrounding boroughs of Queens, Brooklyn, the Bronx, and Staten Island from the year 1609 through present day. While initial growth took place in lower Manhattan, it didn't take long for the other four boroughs to catch up.
Related Laughing Squid PostsAn Amusing New York City Map Showing Where the Dogs With the Most Popular Names in 2015 Live80s.NYC, An Online Collection of Street View Photos Taken in All Five Boroughs During the 1980sPlayers Can Create Their Own New York City Subway Maps in the New Online Game 'Brand New Subway'This animation illustrates the development of NYC's street grid and infrastructure systems from 1609 to the present-day, using geo-referenced road network data and historic maps. The resulting short film presents a series of "cartographic snapshots" of NYC's built-up urban area at intervals of every 20-30 years history.
Follow Laughing Squid on Facebook, Twitter, Flipboard and Subscribe by Email.
The post An Animated Map Showing Urban Growth in the Five Boroughs of New York City From 1609 to Present Day first appeared on Laughing Squid.