Census survey: Biking, walking and transit up as commute data corrects itself + Driving alone down to 44.5%
Last year, you likely saw a story (or many) saying that biking was way down in Seattle. That was due to the annual release of the Census Bureau's annual American Communities Survey data, which can vary quite a bit year-to-year. And the 2017 figures were way down.
But as we noted, these numbers were likely just outliers because they ran counter to the ten-year trend. And the 2018 survey results that just dropped seem to confirm that, with walking, biking and transit use significantly up compared to 2017.
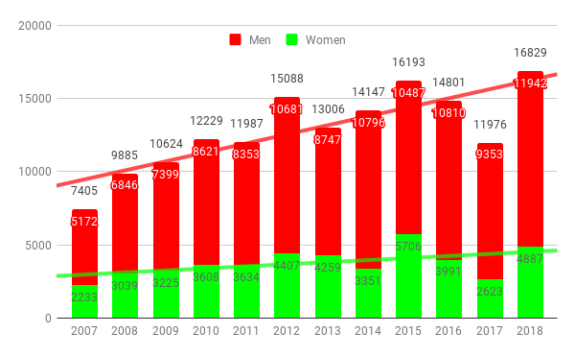
Just as it was inaccurate last year to say that biking was down to a ten-year low, it is also inaccurate this year to say that biking increased 35% in just one year. These dramatic ups and downs are almost certainly just statistical noise. In reality, the trend line for bike commuting is on a steady upswing, and the 2018 figures fall much more in line with the trend than 2017:

City of Seattle bike commuters by sex (the terminology used by the survey).
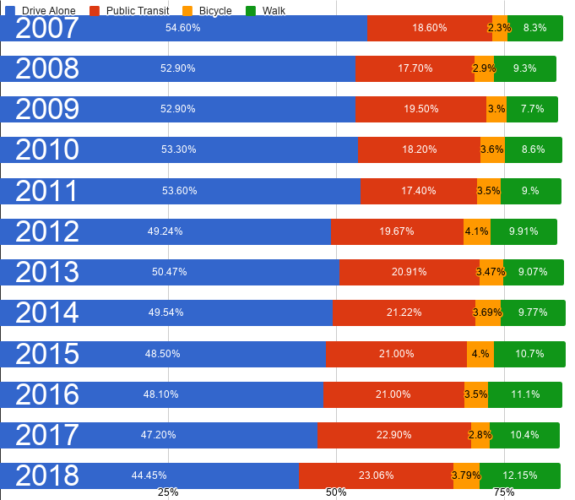
More people in Seattle are biking as their primary way of getting to work than ever before. Both walking and transit use also continued their climbs in the 2018 survey. Walking to work is now up to an incredible 12% citywide, nearly double the rate in 2005. Public transit is closing in on a solid quarter of commutes, clocking in at 23%.
And all this added together means walking, biking and transit is up to 39%, and driving alone to work continues its steep decline. Now just 44.5% of Seattle workers drive alone to work, down from 53% a decade ago. Even if the 2018 estimates end up being a bit high, Seattle is on trend for walking, biking and transit use to overtake driving alone just a few years from now, a feat very few U.S. cities have accomplished.
 Of course, this is not guaranteed to continue. These trends are the result of a lot of hard work by public agencies and advocates working to make walking, biking and transit more convenient. And as positive as this trend is, the state is doing their best to bring driving back. The SR 99 tunnel opened in 2019, and WSDOT has yet to build its massive waterfront surface highway. These multi-billion-dollar investments could very well bring driving numbers back up. So, uh, good job WSDOT?
But at the same time, Seattle is preparing some vital bike connections, including the south downtown bike lanes to finally provide a comfortable bike route between the International District and the 2nd Ave bike lanes. Sound Transit will open several more Seattle light rail stations in coming years. And a lot of new housing is set to open near jobs and transit, which boosts walking, biking and transit numbers. It will be very interesting to see how these numbers change in the next five years.
Speaking of these numbers, it's always important to note some caveats about this survey. The annual American Community Survey asks residents which mode of transportation they used most to travel to work "last week." So this is not a measure of all trips, only commute trips. Students aren't included. Neither are trips to the grocery store or the park or a friend's house. And there is no accounting for mixed trips, where someone bikes (or uses bike share) to connect to transit or for people who bike some days but not others. And by asking "last week," a response will be very weather (and wildfire smoke) dependent. So, for example, many of the people who started biking to UW Station when it opened in 2016 would be filed under public transit, not biking. And "sex" data is only asked as a binary, so gender is poorly represented. But this is our most consistent nationwide transportation data set, which is why you see it referenced to often. In Seattle, real-time bike counters are probably better indicators of bike use. And those " wow. Off the charts. Stay tuned for more about what they are telling us about bike use in 2019.