What Q2 fundraising data tells us about the rest of 2020
It's safe to say that no one could have predicted how this year's fundraising marketplace was going to shape up. The beginning of the year saw us trending toward a blockbuster start, similar to 2018, rather than the steady burn of 2019. But after March there was no clear road map for how VCs and founders were going to react.
We've been tracking three key data metrics from the 2020 DocSend Startup Index to show us real-time trends in the fundraising marketplace. Using aggregate and anonymous data pulled from thousands of pitch deck interactions across the DocSend platform, we're able to track the supply and demand in the marketplace, as well as the quality of pitch deck interactions.
The main two metrics are Pitch Deck Interest and Founder Links Created. These are leading indicators for how the fundraising marketplace is shaping up as it measures the activity happening around the pitch deck. As that interest peaks, we expect the amount of funds deployed to increase in the months after. Pitch Deck Interest is measured by the average number of pitch deck interactions for each founder happening on our platform per week, and is a great proxy for demand.
Founder Links Created is how many unique links a founder is creating to their deck each week; because each person you send a document to in DocSend gets a unique link, we can use this as a proxy for supply by looking at how many investors a founder is sharing their deck with per week.
Here's what we saw in Q2 and how that will affect the rest of the year.
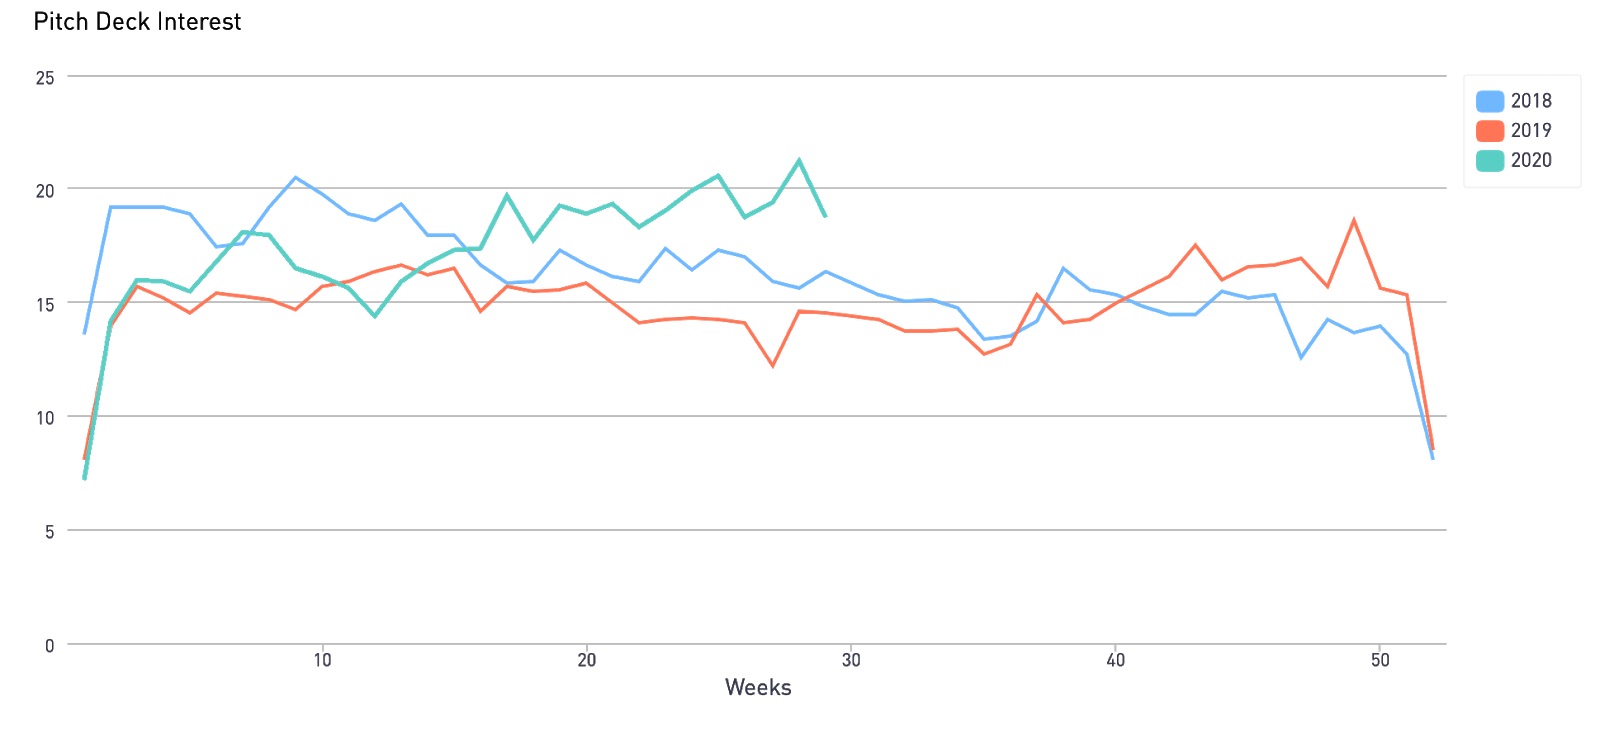
VCs are shoppingVC interest has been at an all-time high over the last quarter. Interest rebounded over the course of a few weeks after the pandemic was declared and shelter-in-place orders were given. But once interest rebounded to pre-pandemic levels it did something surprising. It kept climbing. In fact, the top 10 weeks for VC interest this year were all in Q2. Overall, interest was up 21.6% QoQ and 26% YoY. This means we're looking at VCs viewing more pitch decks than they have any time in the last two years.
This is in spite of VC interest traditionally declining from late spring into summer, before bottoming out during the last two weeks of August. After the initial peak in the spring, VC interest typically doesn't rebound until October.

Image Credits: DocSend (opens in a new window)
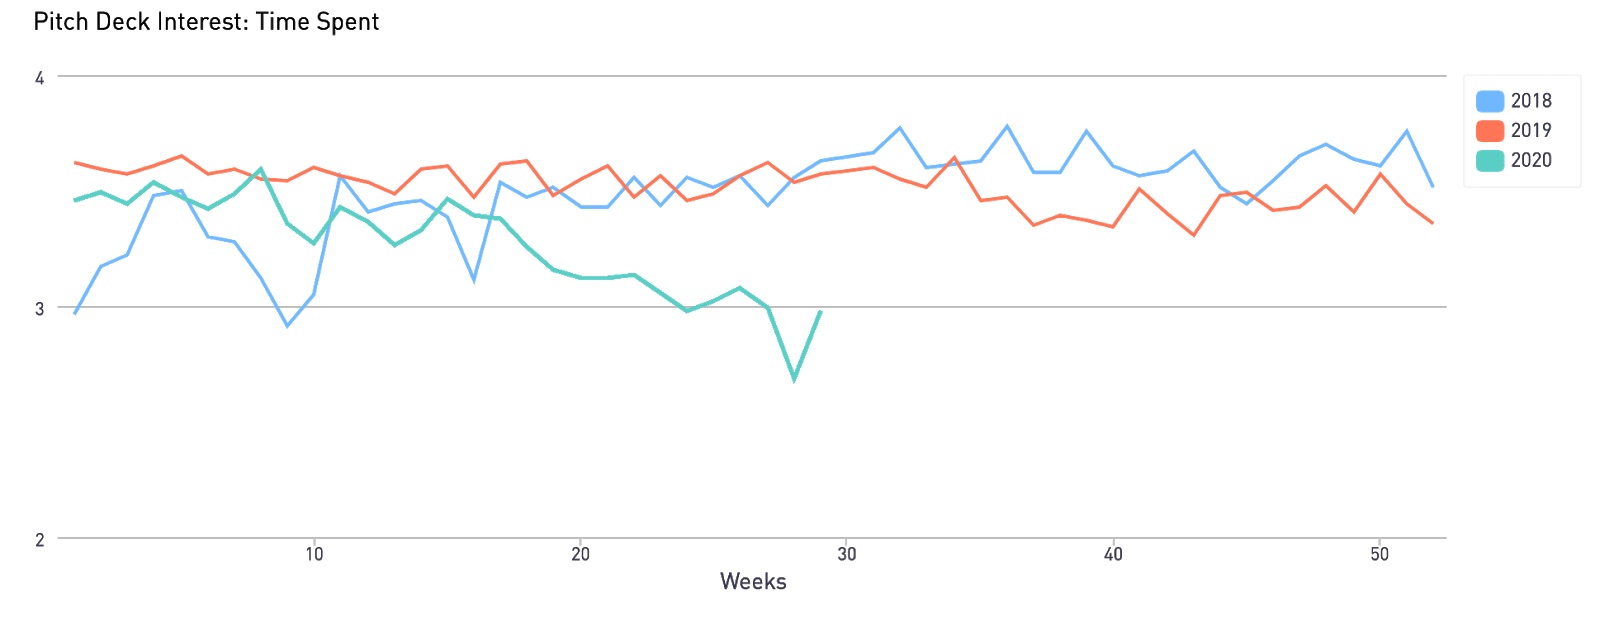
But not only can we see that VCs are interacting with a lot of decks, we also can determine the quality of those interactions. We measure how long a VC spends reading each deck. From our previous research we know that the average pitch deck interaction is less than 3.5 minutes. But the amount of time VCs spent reading each deck in Q2 steadily declined, going below two minutes toward the end of the quarter. This tells us VCs are speeding through decks. That means they either know what they're looking for and aren't wasting time, or they're scrutinizing decks less, opting for a Zoom call to hear more from a founder.

Image Credits: DocSend (opens in a new window)
For founders, this means having a tight deck is even more important than before. Don't have more than 20 slides, don't send your appendix in your send-ahead deck and keep your slides concise and thoughtful (read our guide on how to put together a send-ahead deck here).
If you're still not able to get a meeting with a VC during this intense shopping season, you may want to consider changing your fundraising strategy.
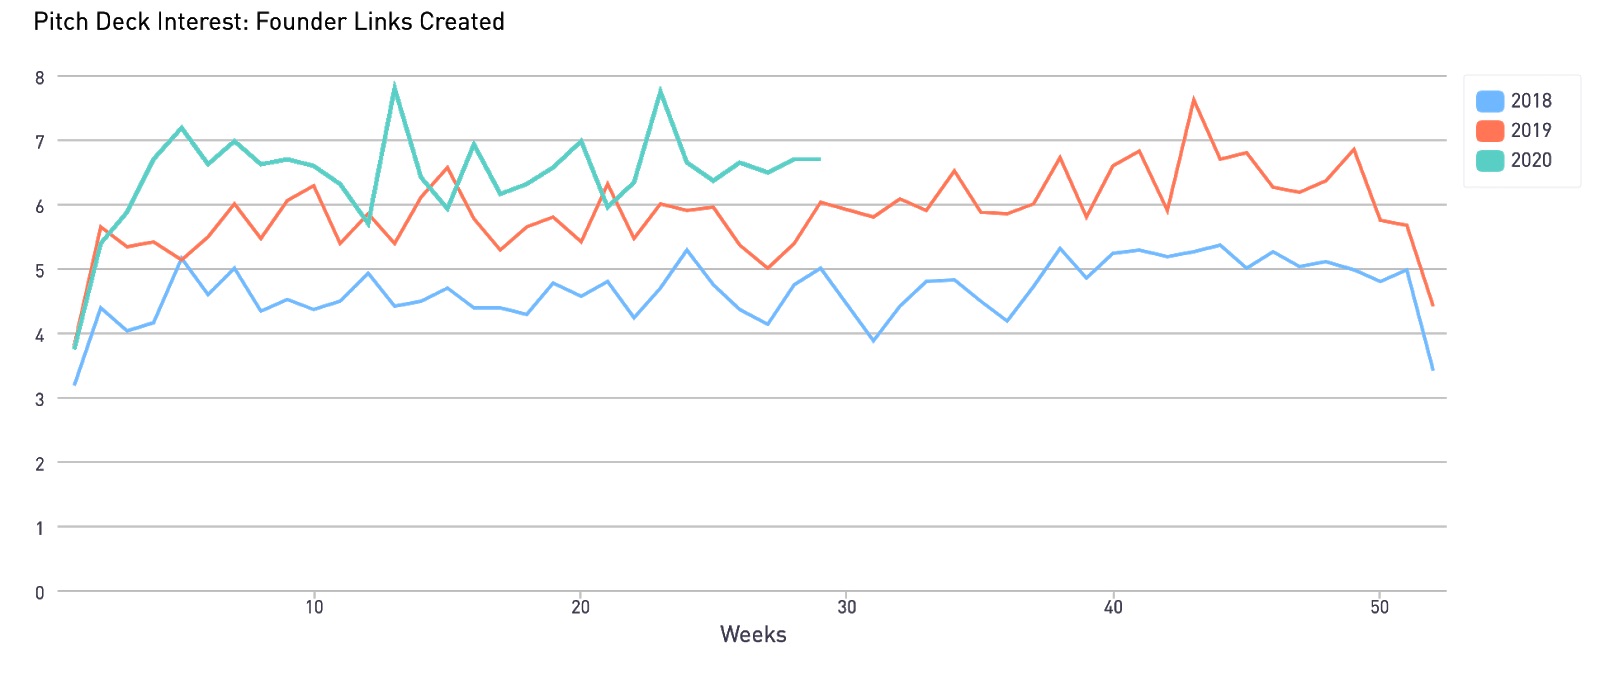
Founder timelines have changedWe can see over the last quarter that there have been clear spikes in the amount of links founders are sending out. Founders sent out 11% more deck links in Q2 than they did in Q1, but what's interesting is that the number of links created actually dropped below 2019 levels on three separate occasions. So while founders might have been rushing to send their deck out during unstable times, there were plenty of weeks where founders were hanging back.
This conflicting story can tell us several things. First, founders have most likely condensed their fundraising efforts. According to our research earlier this year, the average pre-seed round takes longer than three months to complete. For those fundraising during a pandemic, three months can seem like a lifetime. This is not only due to the logistics of setting meetings with VCs who have packed calendars, but also the iteration process of receiving feedback from a potential investor, working on your deck, then sending it out to new targets. With global uncertainty, many founders likely decided to shorten their time away from their business by reducing their fundraising efforts to just a few weeks.
Second, due to aggressive cost cutting at the beginning of the pandemic, many founders found themselves with more runway than they expected. In fact, according to a recent survey we did, nearly 50% of founders changed their fundraising timeline by either moving it forward or delaying it. Founders that could afford to decided to avoid the volatile fundraising marketplace in an effort to preserve their valuations.

Image Credits: DocSend (opens in a new window)
We're looking at more than displaced interest from MarchWhile it was easy during April and early May to think the fundraising marketplace was experiencing delayed activity due to the crash in March, the sustained interest makes it hard to believe that's still the case, especially taking into account seasonality. The last week of the quarter saw a 37% increase in interest over 2019 and an 18% increase over 2018. With that level of activity, we've clearly entered a new normal for fundraising.
While valuations might be fluctuating, it's quite clear VCs are shopping. To figure out why, you don't have to look any further than the 2008 financial crisis. The businesses born out of crises tend to address real, systemic problems that require big, bold fixes. And the pandemic has certainly laid bare many societal issues that are worth addressing.
What Q3 and Q4 could look like based on current trendsIf it's clear that VCs are shopping, and it's clear that this isn't displaced interest from earlier this year, what does that mean for the future? We would normally see an increase in founder activity starting in late summer, leading to peak VC interest in the fall. Founder activity has been up and down, and VC interest has been steadily rising, which tells us there's still pent-up demand to deploy capital. We should also see many founders who delayed their fundraising efforts enter the marketplace in the next few months. If pandemic conditions worsen, we might also see founders who had decided to push their fundraising efforts to next year moving their timelines forward.
If the current level of interest represents the new normal for VCs, we expect it to only increase as we enter the fall. And with more founders coming online in early to late fall, that pent-up demand should result in an increasingly active market. If you're a founder, I would recommend kicking off your fundraise now in order to capitalize on the increased interest from investors and decreased competition for at least the first pitch meeting.