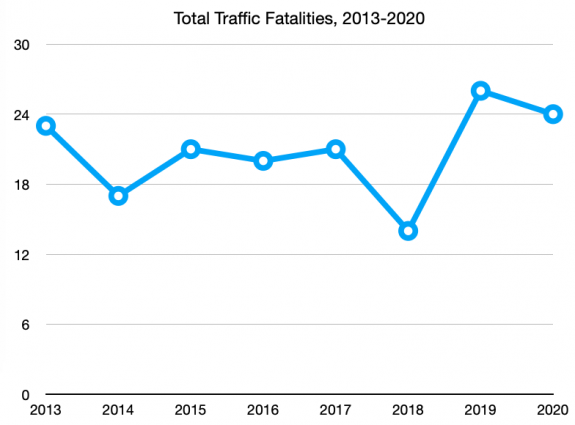
Seattle continues to stagnate on preventing traffic deaths even as total collisions plummet
Preliminary data on traffic collisions from last year shows that the total number of collisions involving people on bikes in Seattle was down by more than 50% compared to the average of the three previous years. This follows the trend in overall traffic crashes, which SDOT says went from 230 per week to 115 in 2020.
One big footnote here is that this data is always unreliable; absolutely more so in 2020 as the number of people who would be hesitant to file a report with the Seattle police increased and the police side was more likely to deem something else a higher priority. But it's the best we have to get a snapshot into what happened on our city's streets last year.

Even as traffic collisions fell, the overall number of people who lost their lives in traffic last year did not decline as well. Preliminary numbers show 24 people were killed in the year, as noted by the Seattle Times earlier this week, a number only matched in recent years by 26 fatalities in 2019.

Fourteen of the twenty-four people who were killed on Seattle's streets last year were using our streets for walking or biking. This is a continuing trend, where a larger and larger percentage of fatalities are people using active transportation.
The citywide reduction in speed limits on arterials that was put into high gear in the fall of 2019 is being cited as a success story by SDOT: they note a 20-40% drop in the number of crashes in locations with new 25 mph signs", which they say was observed before the drop in traffic volumes seen last March. But that report only looked at North Seattle locations, and few high-crash corridors.
At Rainier Ave and S Holly, where the Mayor unveiled the initial 25 mph sign at her 2019 press conference, an October 2020 speed study showed 91% of drivers in either direction were going above the speed limit, with 61% of drivers going over 30 mph on the street.

Mayor Durkan unveils a 25 mph speed limit sign on Rainier Ave in 2019
That lines up with data from another very frequent crash corridor, Aurora Ave N, which hasn't seen speed limit changes recently but where data shows that drivers are frequently exceeding the speed limits. Both Rainier Avenue and Aurora Avenue saw traffic fatalities in 2020. All signs to point to more robust traffic design overhauls needed on Seattle's busiest corridors, even if speed limit signs may have an impact on the less busy corridors.
Statewide Washington saw higher traffic fatalities than it did in all but one year in the past decade: 560 people across the state died in traffic violence, or one approximately every sixteen hours in 2020. WSDOT Secretary Roger Millar has attributed this trend to people speeding, citing an individual driver going way over the speed limit in Snohomish County on I-5. But simply using one explanation ignores all of the areas of opportunity, including the ones laid out by WSDOT itself in its Active Transportation plan.

Year over year traffic fatalities were up 4.1% in Washington as a whole last year.
Next month will mark six years since Seattle's Vision Zero pledge, with not much to show for it. Washington State as a whole has been signed on to that pledge since 2000. We are heading the wrong direction, and it's going to take real investment to change the dynamic.