Everywhere chaotic map on the sphere
Let f be a complex-valued function of a complex variable. The Julia set of f is the set of points where f is chaotic. Julia sets are often complicated fractals, but they can be simple. In this post I want to look at the function
f(z) = (z^2 + 1)^2 / 4z(z^2 - 1).
I learned about this function from the latest 3Blue1Brown video. This function is a Lattes example. (I misread this at first and thought it was Latte's example, but it is one of a family of examples by the French mathematician Samuel Lattes.)
What makes this function interesting is that its Julia set is the entire plane. That is, iterates of the function are sensitive to starting point no matter where you start.
I wanted to play around with this function, but plotting iterates would not be practical if they wander all over the complex plane: no matter how big a region I plot, the points will leave that region, and possibly leave quickly. So instead of looking at iterates on the complex plane, I'll look project them onto a sphere so we can see them all at once.
Riemann sphereThis is a good time to come clean about a detail I left out. From the beginning I should have said that f is a map not from the complex plane to itself but from the Riemann sphere
{}
to itself. I didn't gloss over much, just one point, the point at infinity. In our example, we'll define f(0) = and the resulting extension is continuous as a map from the sphere to itself.
Not only will moving to the sphere make things easier to see, it's actually where our function naturally lives.
Stereographic projectionImagine a unit sphere sitting on top of the complex plane. Stereographic projection maps every point on the sphere, except the north pole, to a point in the plane. Draw a line between the north pole and a point on the sphere, and its stereographic projection is where the line intersects the plane. The north pole itself has nowhere to go. When we extend the complex plane by adding a point , we can map the north pole there.
We're actually interested in the inverse of stereographic projection because we want to go from the plane to the sphere. Let's define a function p[u, v] that carries out our inverse stereographic projection in Mathematica.
p[u_, v_] := ResourceFunction[ "InverseStereographicProjection"][{u, v}]Plotting iteratesWe want to pick some arbitrary starting point z0 and look at the sequence
z0, f(z0), f(f(z0)), f(f(f(z0))), ...
We can do this in Mathematica with the NestList function. It takes three arguments: the function to iterate, a starting point, and the number of elements in the sequence to produce. For example, if we define
latte[z_] := (z^2 + 1)^2/(4 z (z^2 - 1))
then
NestList[latte, 0.1 + 2 I, 5]
gives us the first five elements in the sequence above.
The projection function p[u, v] above takes x and y coordinates, not complex numbers, so we define our own that takes complex numbers.
projection[z_] := p[Re[z], Im[z]]
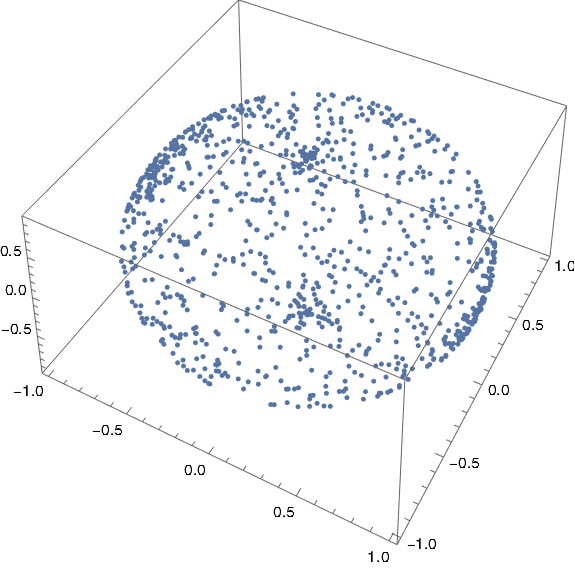
Now we're can plot our iterates. I chose 10 + 1.9i as a starting point based on today's date, October 19, but you could pick any non-zero starting point. And that's kinda the point: any place you start will have the same chaotic dynamics [1].
Here's our plotting code.
ListPointPlot3D[ Map[projection, NestList[latte, 10 + 1.9 I, 1000]], AspectRatio -> 1]
And here's the plot:

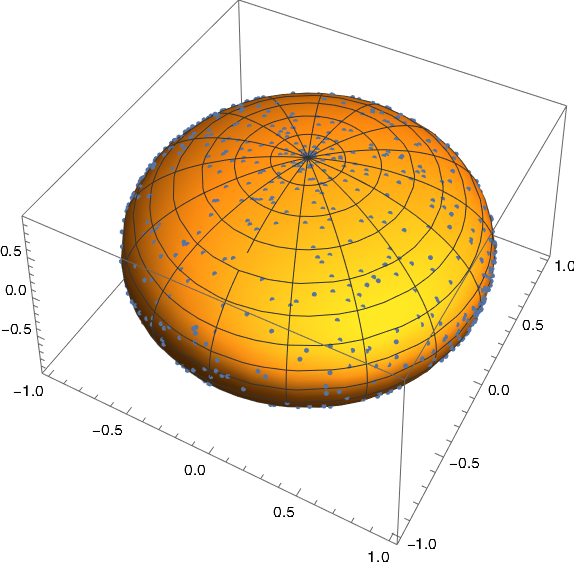
We could plot a sphere with
SphericalPlot3D[1, {t, 0, Pi}, {ph, 0, 2 Pi}]and stack the two plots to make it clear that the points are indeed on a sphere.

[1] If you start with 0, you'll next go to and stay there. But 0 and are parts of the Julia set too because the points in the neighborhoods of these points lead to chaos, no matter how small you take the open neighborhoods to be.
The post Everywhere chaotic map on the sphere first appeared on John D. Cook.