Mercator and polar projections
This post is a more quantitative version of the previous post. Before I said that straight lines on a Mercator projection map correspond to loxodrome spirals on a sphere. This post will make that claim more explicit.
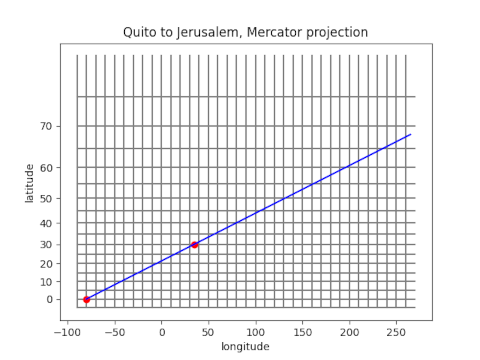
So suppose we plot a straight path from Quito to Jerusalem on a Mercator projection.

The red dot in the lower left corner represents Quito and the next red dot represents Jerusalem.
Mercator projection leaves longitude unchanged, but latitude is transformed via
log( sec + tan )
for reasons explained here. We can apply the inverse of the Mercator projection to put the path above on a globe, and when we do, it looks like the following.

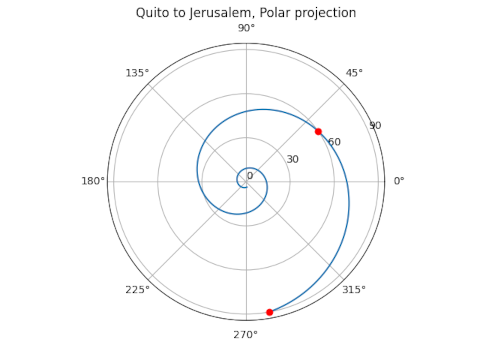
The path planned on a Mercator projection map when projected onto the globe becomes a logarithmic spiral in polar projection. The radial direction in the plot above shows the angle down from the North Pole rather than the angle up from the equator.
So if our flight of constant bearing keeps going rather than stopping at Jerusalem, it will spiral quickly toward the North Pole. It appears to stop at pole unless you look carefully. In theory the spiral keeps going and never actually reaches the pole. This is easy to see on the Mercator map because the North Pole is infinitely far away on the vertical axis.
The post Mercator and polar projections first appeared on John D. Cook.