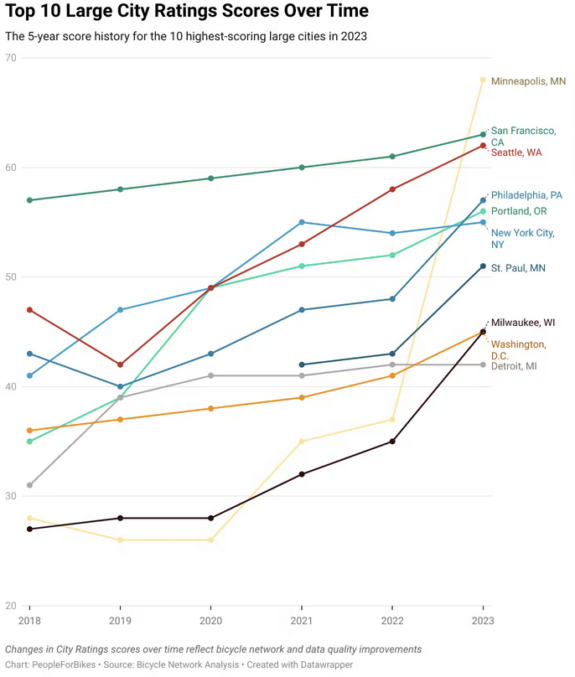
Seattle scores 62/100 in bike-friendly ranking, good enough for 3rd place among big U.S. cities
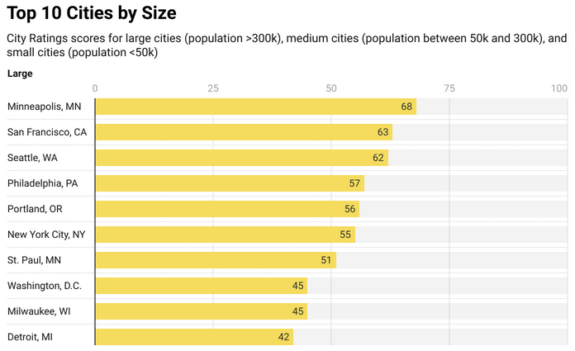 From People For Bikes.
Bike-friendly city rankings are a bit silly, but there's usually some interesting things we can learn from them. There are so many variables that make places different and might impact a person's experience riding a bike in them that distilling an entire city's bikeability down to a number is impossible. For example, I'm guessing someone who lives along Rainier Avenue, which has no bike lanes and no comparable alternative bike routes, might scoff at the idea that Seattle is the third best large U.S. city for biking. But that's where People For Bikes placed our city in its 2023 Best Places to Bike list.
But before Seattle goes and gets a big head about its spot on the bike-friendly podium, the city only scored a 62 out of 100. Only cities with 80 points or more are considered places where most common destinations are accessible by safe, comfortable bike routes," according to People For Bikes. So there's still a lot of work left to do. Unfortunately, the competition to be the most bike-friendly city in the U.S. just is not very fierce. There are many places where people talk about being bike-friendly, but not enough places are actually out investing in making the necessary changes.
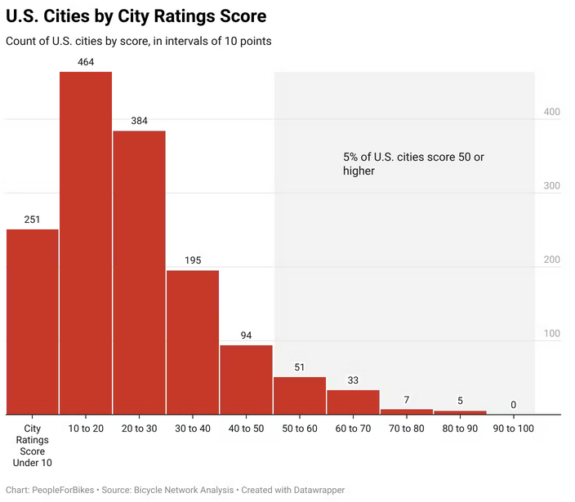 Seattle scored a 62, which is unfortunately elite among U.S. cities. This chart includes cities of all sizes.
Seattle's score seems to be greatly helped by the city's wide use of lower speed limits. The default speed limit for an arterial street in Seattle is 25 mph (unless signed otherwise), and the default limit for a residential street is 20 mph. While these lower limits are great, it's also a bit unclear how big an effect a blanket default speed limit change has on actual safety. When the city installs speed limit signs and especially when SDOT makes physical changes to the road design to encourage slower speeds, lower speed limits provide a significant safety benefit. But on unchanged streets without speed limit signs, lowering the default limit can feel more like a change on paper than in real life.
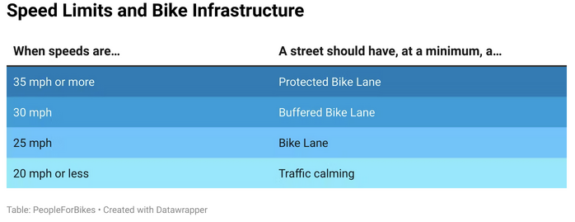
People For Bikes also analyzed cities' bike network quality by comparing the bike infrastructure level of protection against a street's speed limit. So Seattle may have juiced its score a bit by making all our old paint-only, door zone bike lanes score better since they are not on a supposedly 25 mph street rather than a 30 mph street. So even though these old door zone bike lanes are not actually any safer to use now than they were when they were first painted, lowering the default speed limit likely made them score better. I like what People For Bikes is trying to do with this metric because cities shouldn't get credit for painting an inadequate bike lane on a giant, fast street. But also, this is why distilling a city's bike experience into a number is always going to be messy.
But People For Bikes has designed this bonus for lowering speed limits purposefully, which gets at the potential benefit of these rankings: Encouraging cities to try to improve so they can climb the list next year. Slightly more than half of U.S. cities have speed limits of 25 mph or less on residential roads, while the remaining cities with speed limits of 30 mph or greater on residential roads could improve the safety of their bike network by reducing travel speeds," People For Bikes wrote in their summary of the 2023 ratings. So wink wink nudge nudge, lower your speed limits if you want to see all your existing bike lanes score better. And also, you know, improve safety for all your residents.
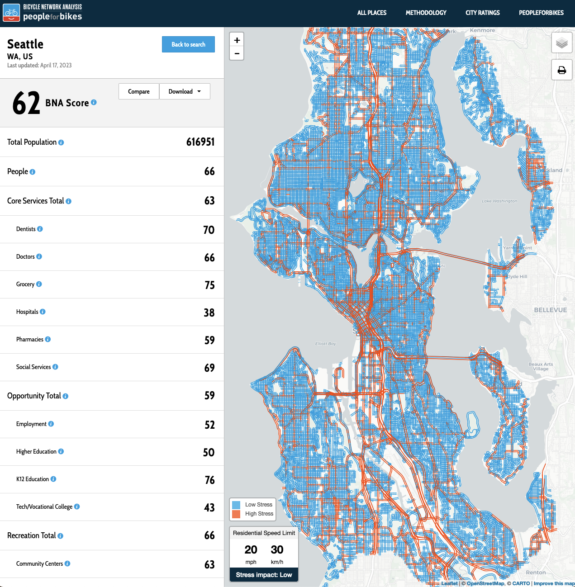 Check out the interactive version from People For Bikes.
Another reason large ratings systems like these get messy is that there are always going to be big differences between a GIS, bird's eye analysis of a place and the actual experience on the ground. For example, the map of Seattle's Bicycle Network Analysis" shows the city getting a ton of credit for residential streets regardless of whether those streets are actually useful for biking. In a city as steeply hilly as Seattle, the real number of usable routes is much, much lower than this map would suggest. It also can't seem to tell the difference between a path that's really a sidewalk (like along Lake Washington Boulevard) and a path that's appropriate for biking. Also, look how bikeable Broadmoor is! The map also includes parts of surrounding cities and unincorporated areas, which is a bit confusing. An analysis used to assess 1,733 places at once is going to get messy when you zoom in, but I'm sure some of this can be cleaned up in the future.
(Side note for those who really care about consistency in these rankings: In 2022, Seattle was listed as number 3 behind Brooklyn and San Francisco. In 2023, they not only decided to group the boroughs into one New York City rating, but they also retconned the previous years to also include NYC as one listing. So that means the revised 2022 rating shows Seattle in 2nd place. Minneapolis, meanwhile, skyrocketed from ninth place in 2022 to first place in 2023, likely due to People For Bikes giving speed limits such a significant role. Minneapolis lowered their default speed limits in 2020, and they also have a ton of old paint-only bike lanes like Seattle. Anyway, ratings are silly. I don't think Minneapolis actually went from ninth to first in one year just like I don't know if Seattle deserves to be ahead of Portland or New York City or Washington DC, all places that are really difficult to compare. It seems that the focus on speed limits and having the right kind of bike lane for each street based on the speed limit has had this unfortunate side effect of heaping new rewards onto actions taken more than a decade ago. A door zone bike lane is a poor design whether the speed limit is 30 or 25, and riding in them did not suddenly become a great experience in 2023.)
