The anti-Smith chart
As I've written about several times lately, the Smith chart is the image of a rectangular grid in the right half-plane under the function
f(z) = (z- 1)/(z+ 1).
What would the image of a grid in the left half-plane look like?
For starters, sincef maps the right half-plane to the interior of the unit circle, it must map the left-half plane to theexterior of the unit circle.
As we said before, the functionf is a Mobius transformation, and so it takes generalized circles, i.e. either a circle or a line, to generalized circles. So the grid lines in the left half-plane are either mapped to lines or circles. Which is it?
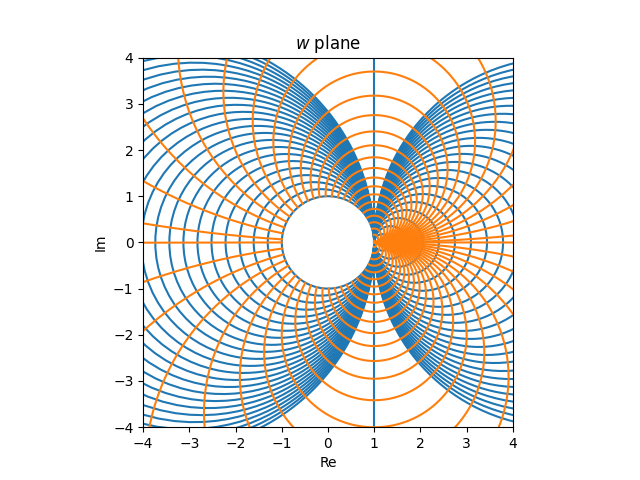
The functionf has a singularity at -1 and so the image of any line (or circle) throughz = -1 is unbounded, i.e. a line, not a circle. Any line not passing through -1 has a bounded image, which must be a circle.
The line Re(z) = -1 in thez plane is mapped to the line Re(w) = 1 in thew plane. Otherwise a vertical line crossing the real axis atx is mapped to a circle passing throughw = (x - 1)/(x + 1). The circle also passes throughw = 1 becausef() = 1. The circle is symmetric about the real axis, and so this is enough information to uniquely determine the circle.
Note that (x - 1)/(x + 1) > 1 whenx < -1 and so vertical lines with real part less than -1 are mapped to circles to the right ofw = 1. When -1 <x < 0, vertical lines are mapped to circles to the left ofw = 1.
The images of horizontal lines we've looked at before. These are all circles passing throughw = 1 and tangent to the circles that are images of vertical lines. But this time instead of taking the portion of the circles inside the unit circle, we take the portion outside the unit circle.
And without further ado, we present the anti-Smith chart, the image of a grid in theleft half plane.