Rolling correlation
by John from John D. Cook on (#71BGK)
Suppose you have data on the closing prices of two stocks over 1,000 days and you want to look at the correlation between the two asset prices over time in rolling 30 day windows.
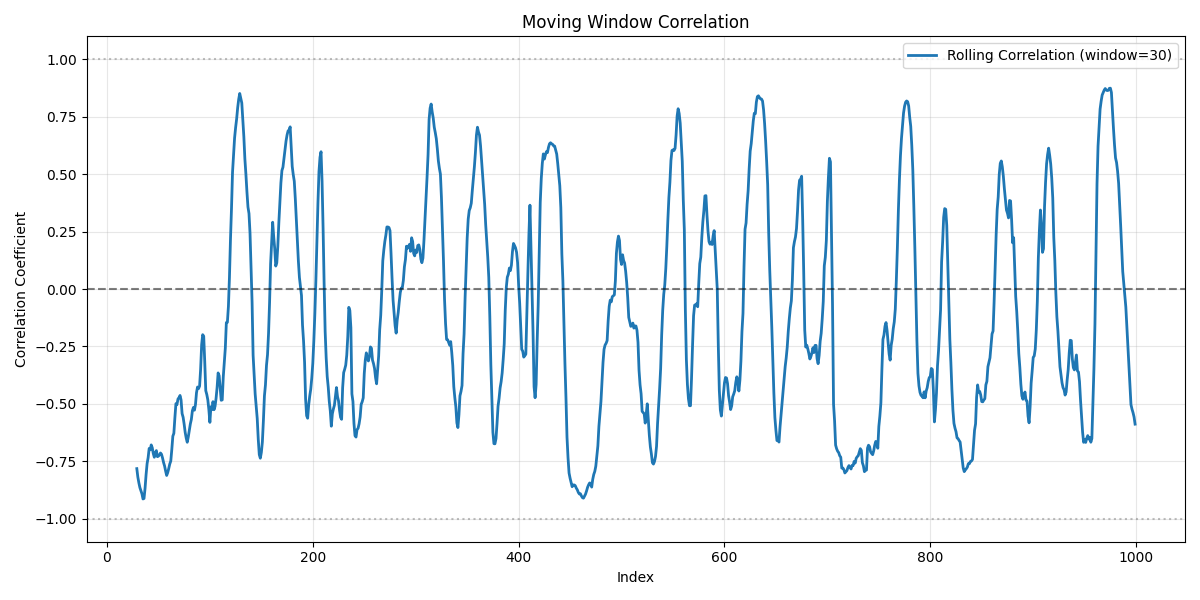
It seems that the rolling correlation is periodic. peaking about every 50 days.
But this is an artifact of the rolling window, not a feature of the data. I created the two simulated stock time series by creating random walks. The price of the stock each day is the price the previous day plus a sample from a normal random variable with mean zero and variance 1.
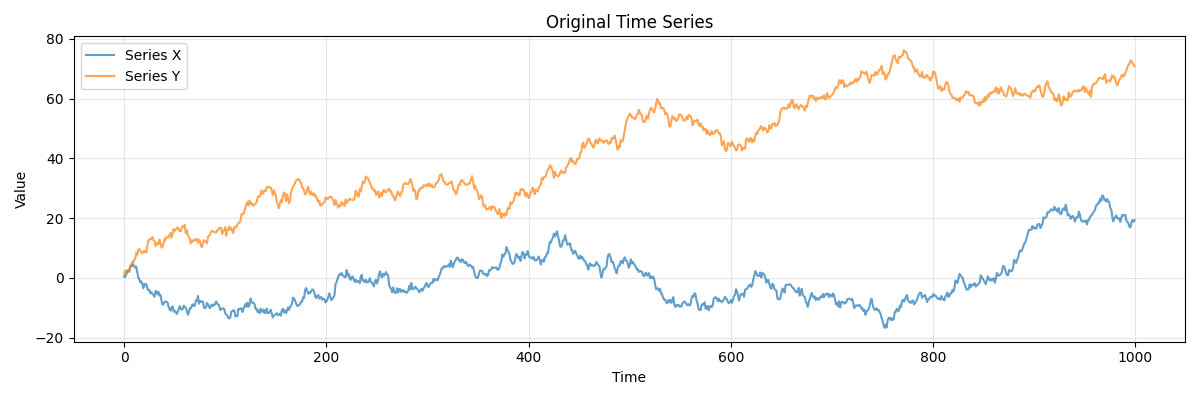
import numpy as npfrom scipy.stats import normn = 1000x = np.cumsum(norm.rvs(size=n))y = np.cumsum(norm.rvs(size=n))
If you use a wider window, say 60 days, you'll still see a periodic pattern in the rolling correlation, though with lower frequency.
Related posts- The fractal nature of Brownian motion
- Interpolating Brownian motion
- Time series analysis and forecasting