The Meta logo and fitting Besace curves
I saw a post yesterday saying that the Meta logo is a Besace curve.

A Besace curve has the implicit form

and the parametric form
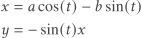
where t ranges over [0, 2].
So given a Besace curve, such as the Meta logo, how do you find the parametersa andb to fit the curve?
We can rewrite the parametric expression forx as a sine with a phase shift (see notes here)

where
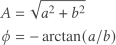
Also, we can rewrite the parametric expression for y as
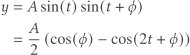
Now the extreme values ofx andy are easier to see. The maximum value ofx isA and the minimum value is -A. The maximum value of y isA(cos() + 1)/2 and the minimum value is A(cos() - 1)/2.
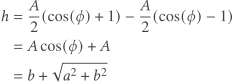
We can simplify the cosine of an arctangent (see here) to find the height, i.e. the difference between the maximum and minimumy value, in terms of a and b.
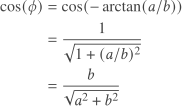
Then the height is given by
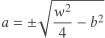
The width is given by

and so

and
Now the Meta logo is drawn with a thick line, and the line width isn't constant. It's a little fuzzy what the height and width of the middle of the curve are, but I estimated h = 120 and w = 200 from one image. This leads tob = 20 anda = 97.98.
The Mathematica code
ParametricPlot[{a Cos[t] + b Sin[t], -Sin[t] ( a Cos[t] + b Sin[t])}, {t, 0, 2 Pi}, PlotStyle -> Thickness[0.05]]produces the following image.
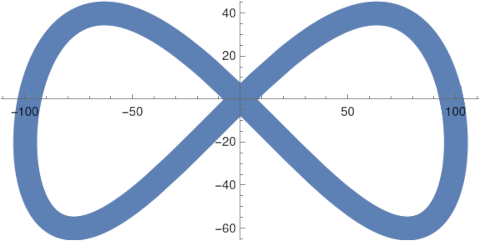
This is reminiscent of the Meta logo, but not a great match. I suspect the logo is not exactly a Besace curve. You could tinker with the a andb parameters and the aspect ratio to get a closer match. The logo may have been inspired by a Besace curve and then drawn by hand.
The post The Meta logo and fitting Besace curves first appeared on John D. Cook.