Graphs and square roots modulo a prime
Imagine a clock with a prime number of hours. So instead of being divided into 12 hours, it might be divided into 11 or 13, for example. You can add numbers on this clock the way you'd add numbers on an ordinary clock: add the two numbers as ordinary integers and take the remainder by p, the number of hours on the clock. You can multiply them the same way: multiply as ordinary integers, then take the remainder by p. This is called arithmetic modulo p, or just mod p.
Which numbers have square roots mod p? That is, for which numbers x does there exist a number y such that y2 = x mod p? It turns out that of the non-zero numbers, half have a square root and half don't. The numbers that have square roots are called quadratic residues and the ones that do not have square roots are called quadratic nonresidues. Zero is usually left out of the conversation. For example, if you square the numbers 1 through 6 and take the remainder mod 7, you get 1, 4, 2, 2, 4, and 1. So mod 7 the quadratic residues are 1, 2, and 4, and the nonresidues are 3, 5, and 6.
A simple, brute force way to tell whether a number is a quadratic residue mod p is to square all the numbers from 1 to p-1 and see if any of the results equals your number. There are more efficient algorithms, but this is the easiest to understand.
At first it seems that the quadratic residues and nonresidues are scattered randomly. For example, here are the quadratic residues mod 23:
[1, 2, 3, 4, 6, 8, 9, 12, 13, 16, 18]
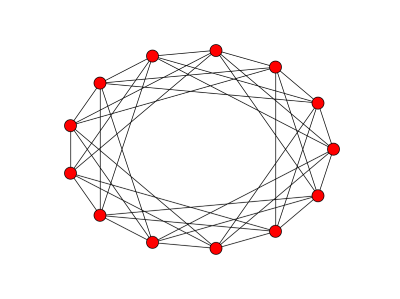
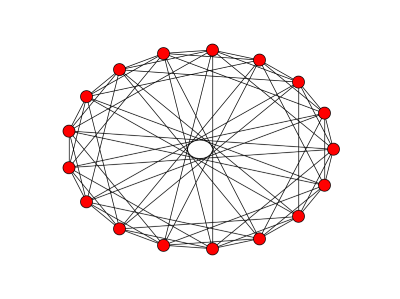
But there are patterns, such as the famous quadratic reciprocity theorem. We can see some pattern in the residues by visualizing them on a graph. We make the numbers mod p vertices of a graph, and join two vertices a and b with an edge if a-b is a quadratic residue mod p.
Here's the resulting graph mod 13:

And here's the corresponding graph for p = 17:

And here's Python code to produce these graphs:
import networkx as nximport matplotlib.pyplot as pltdef residue(x, p): for i in range(1, p): if (i*i - x) % p == 0: return True return Falsep = 17G = nx.Graph()for i in range(p): for j in range(i+1, p): if residue(i-j, p): G.add_edge(i, j)nx.draw_circular(G)plt.show()
However, this isn't the appropriate graph for all values of p. The graphs above are undirected graphs. We've implicitly assumed that if there's an edge between a and b then there should be an edge between b and a. And that's true for p = 13 or 17, but not, for example, for p = 11. Why's that?
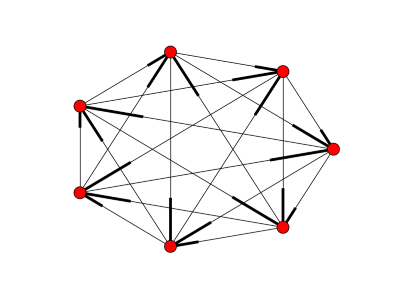
If p leaves a remainder of 1 when divided by 4, i.e. p = 1 mod 4, then x is a quadratic residue mod p if and only if -x is a quadratic residue mod p. So if a-b is a residue, so is b-a. This means an undirected graph is appropriate. But if p = 3 mod 4, x is a residue mod p if and only if -x is a non-residue mod p. This means we should use directed graphs if p = 3 mod 4. Here's an example for p = 7.

The code for creating the directed graphs is a little different:
G = nx.DiGraph()for i in range(p): for j in range(p): if residue(i-j, p): G.add_edge(i, j)
Unfortunately, the way NetworkX draws directed graphs is disappointing. A directed edge from a to b is drawn with a heavy line segment on the b end. Any suggestions for a Python package that draws more attractive directed graphs?
The idea of creating graphs this way came from Roger Cook's chapter on number theory applications in Graph Connections. (I'm not related to Roger Cook as far as I know.)
You could look at quadratic residues modulo composite numbers too. And I imagine you could also make some interesting graphs using Legendre symbols.
Related posts: