Spectral flatness
White noise has a flat power spectrum. So a reasonable way to measure how close a sound is to being pure noise is to measure how flat its spectrum is.
Spectral flatness is defined as the ratio of the geometric mean to the arithmetic mean of a power spectrum.
The arithmetic mean of a sequence of n items is what you usually think of as a mean or average: add up all the items and divide by n.
The geometric mean of a sequence of n items is the nth root of their product. You could calculate this by taking the arithmetic mean of the logarithms of the items, then taking the exponential of the result. What if some items are negative? Since the power spectrum is the squared absolute value of the FFT, it can't be negative.
So why should the ratio of the geometric mean to the arithmetic mean measure flatness? And why pure tones have "unflat" power spectra?
If a power spectrum were perfectly flat, i.e. constant, then its arithmetic and geometric means would be equal, so their ratio would be 1. Could the ratio ever be more than 1? No, because the geometric mean is always less than or equal to the arithmetic mean, with equality happening only for constant sequences.
In the continuous realm, the Fourier transform of a sine wave is a pair of delta functions. In the discrete realm, the FFT will be large at two points and small everywhere else. Why should a concentrated function have a small flatness score? If one or two of the components are 1's and the rest are zeros, the geometric mean is zero. So the ratio of geometric and arithmetic means is zero. If you replace the zero entries with some small I and take the limit as I goes to zero, you get 0 flatness as well.
Sometimes flatness is measured on a logarithmic scale, so instead of running from 0 to 1, it would run from -a to 0.
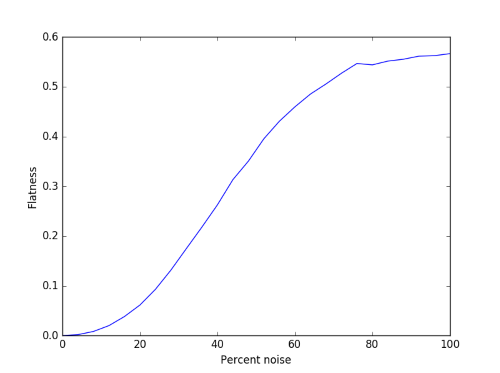
Let's compute the flatness of some examples. We'll take a mixture of a 440 Hz sine wave and Gaussian white noise with varying proportions, from pure sine wave to pure noise. Here's what the flatness looks like as a function of the proportions.

The curve is fairly smooth, though there's some simulation noise at the right end. This is because we're working with finite samples.
Here's what a couple of these signals would sound like. First 30% noise and 70% sine wave:
http://www.johndcook.com/flatness_0.3.wav(download)
And now the other way around, 70% noise and 30% sine wave:
http://www.johndcook.com/flatness_0.7.wav(download)
Why does the flatness of white noise max out somewhere between 0.5 and 0.6 rather than 1? White noise only has a flat spectrum in expectation. The expected value of the power spectrum at every frequency is the same, but that won't be true of any particular sample.
Related posts: