Discrete example of concentration of measure
The previous post looked at a continuous example of concentration of measure. As you move away from a thin band around the equator, the remaining area in the rest of the sphere decreases as an exponential function of the dimension and the distance from the equator. This post will show a very similar result for discrete sequences.
Suppose you have a sequence X1, X2, ", Xn of n random variables that each take on the values {-1, 1} with equal probability. You could think of this as a random walk: you start at 0 and take a sequence of steps either to the left or the right.
Let Sn = X1 + X2 + " + Xn be the sum of the sequence. The expected value of Sn is 0 by symmetry, but it could be as large as n or as small as -n. We want to look at how large |Sn| is likely to be relative to the sequence length n.
Here's the analytical bound:
(If you're reading this via email, you probably can't see the equation. Here's why and how to fix it.)
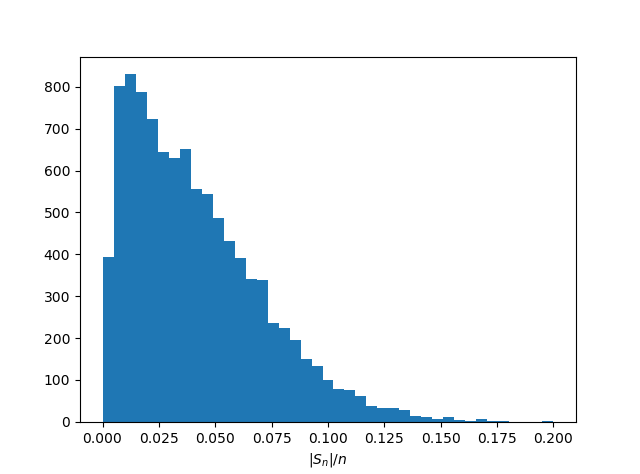
Here is a simulation in Python to illustrate the bound.
from random import randint import numpy as np import matplotlib.pyplot as plt n = 400 # random walk length N = 10000 # number of repeated walks reps = np.empty(N) for i in range(N): random_walk = [2*randint(0, 1) - 1 for _ in range(n)] reps[i] = abs(sum(random_walk)) / n plt.hist(reps, bins=41) plt.xlabel("$|S_n|/n$") plt.show()And here are the results.
