Exponential sums make pretty pictures
Exponential sums are a specialized area of math that studies series with terms that are complex exponentials. Estimating such sums is delicate work. General estimation techniques are ham-fisted compared to what is possible with techniques specialized for these particular sums. Exponential sums are closely related to Fourier analysis and number theory.
Exponential sums also make pretty pictures. If you make a scatter plot of the sequence of partial sums you can get surprising shapes. This is related to the trickiness of estimating such sums: the partial sums don't simply monotonically converge to a limit.
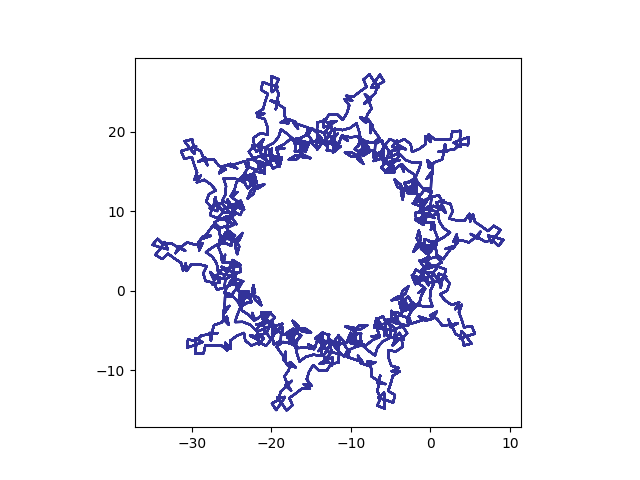
The exponential sum page at UNSW suggests playing around with polynomials with dates in the denominator. If we take that suggestion with today's date, we get the curve below:

These are the partial sums of exp(2Ii f(n)) where f(n) = n/10 + n^2/7 + n^3/17.
[Update: You can get an image each day for the current day's date here.]
Here's the code that produced the image.
import matplotlib.pyplot as plt from numpy import array, pi, exp, log N = 12000 def f(n): return n/10 + n**2/7 + n**3/17 z = array( [exp( 2*pi*1j*f(n) ) for n in range(3, N+3)] ) z = z.cumsum() plt.plot(z.real, z.imag, color='#333399') plt.axes().set_aspect(1) plt.show()
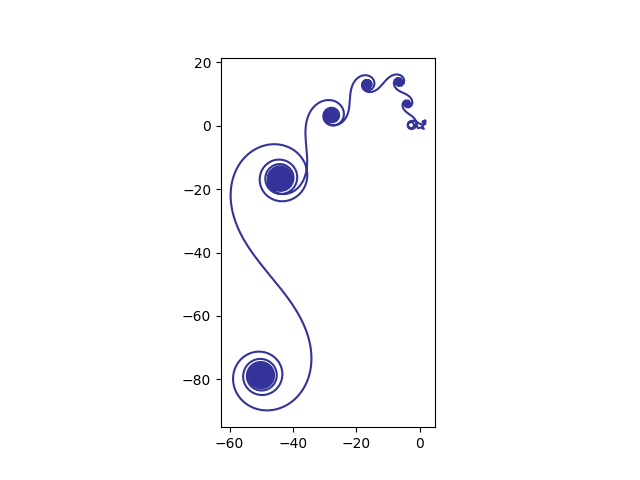
If we use logarithms, we get interesting spirals. Here f(n) = log(n)4.1.

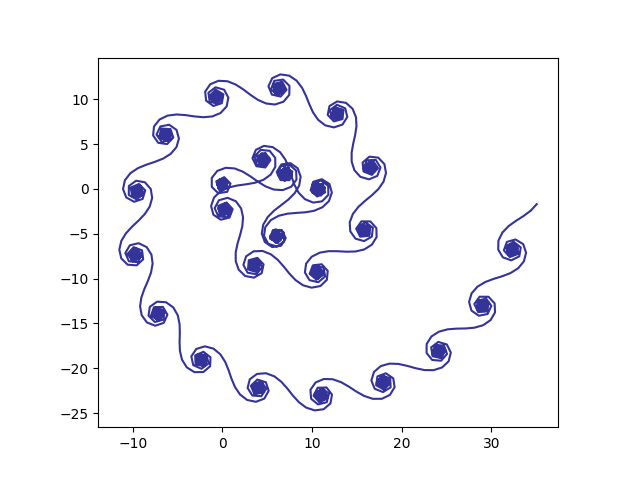
And we can mix polynomials with logarithms. Here f(n) = log(n) + n^2/100.

In this last image, I reduced the number of points from 12,000 to 1200. With a large number of points the spiral nature dominates and you don't see the swirls along the spiral as clearly.