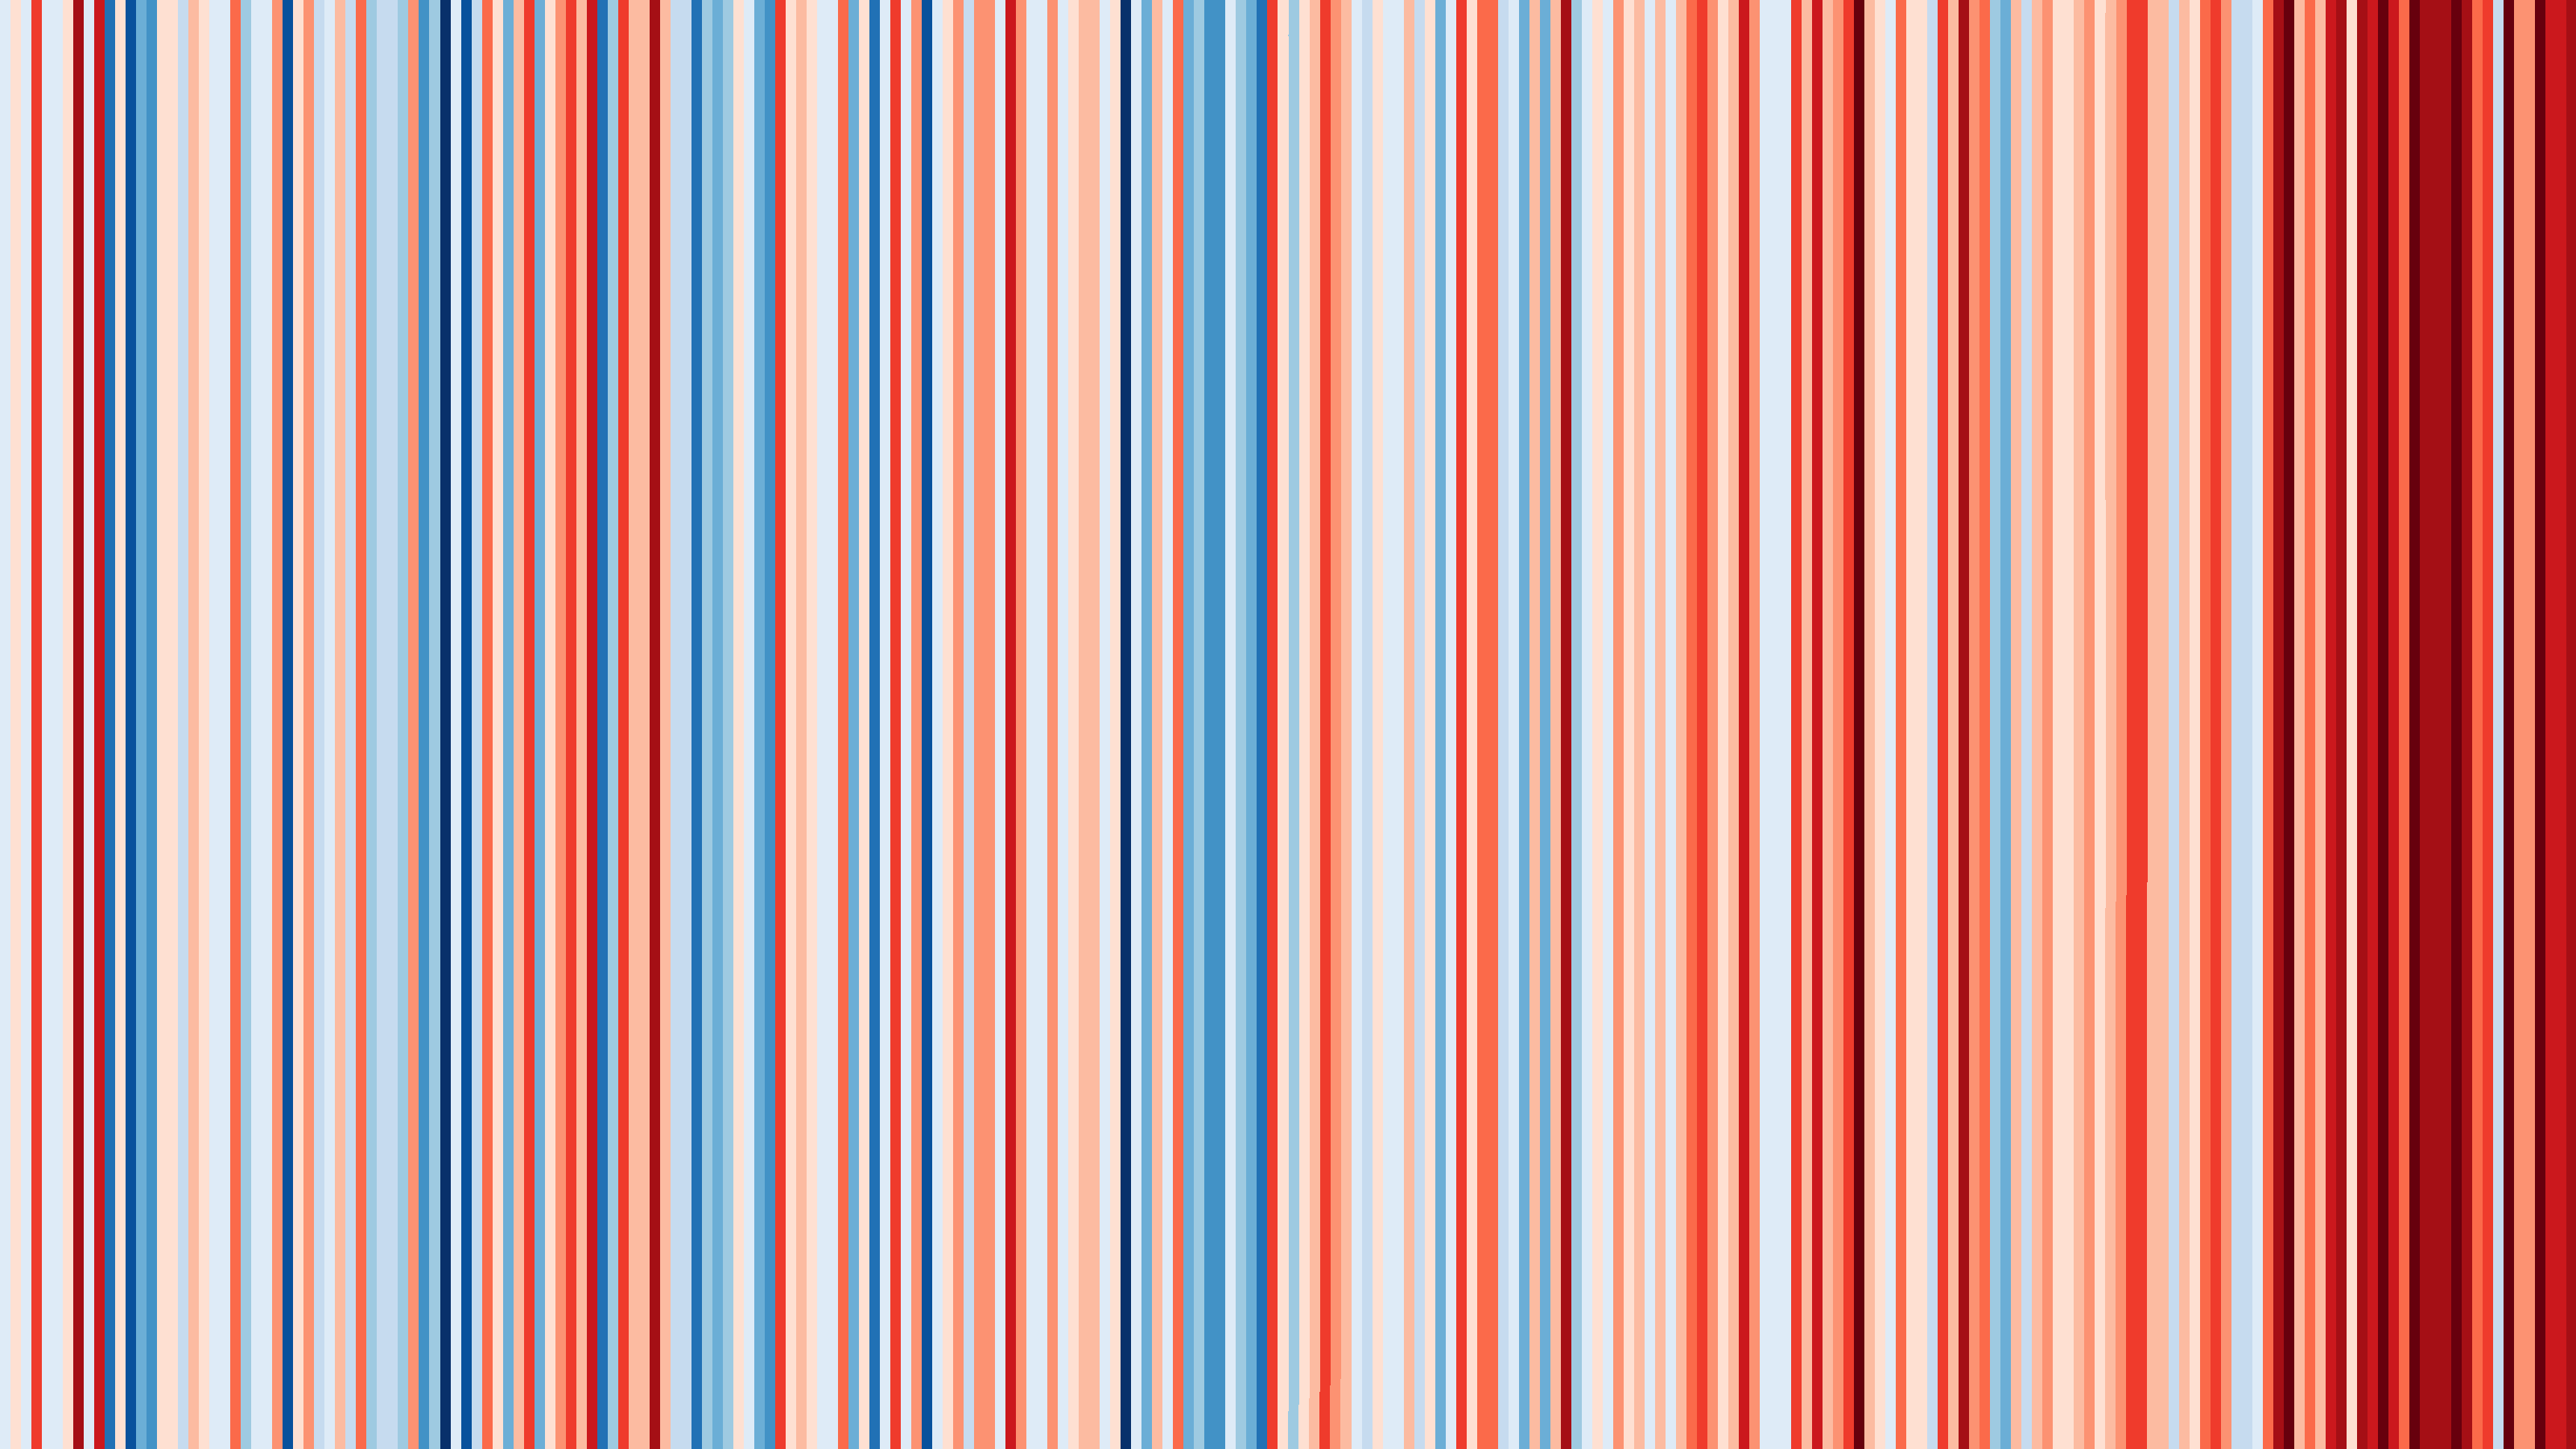
Climate change depicted as vertical stripes by Rob Beschizza from on 2018-05-25 15:40 (#3R0D2) Warming Stripes: (cache) average annual temperatures in England, with each year depicted as a vertical line, from left to right, covering 1772-2017. At the link, see the U.S. and Toronto.