2018 bike counts up 32 percent on 2nd Ave downtown after bike lane, bike share expansion

Bike counter totals (2nd Ave at Marion St)
The final counts are in, and 2018 is officially a new high water mark for biking in Seattle.
Looking at the real-time bike counter data from around town, biking was up significantly in Fremont and across the lower West Seattle Bridge. But the real eye-catcher was 2nd Ave downtown, which saw a 32 percent jump over 2017.
The 2nd Ave numbers are particularly exciting because they demonstrate how bike share and an expanded network of protected bike lanes can work together to seriously increase bike use in a very short period of time. The Belltown extension of the 2nd Ave bike lane opened in January 2018, around the same time that bike share companies ofo, Spin and Lime increased the number of bikes on Seattle streets to a couple thousand each.
It's all but impossible to say which had a bigger effect on the increase, but it's clear that the combination of bike share availability and safe, comfortable bike lanes works.
But bike trips weren't just up on 2nd Ave. Both the Fremont and lower West Seattle Bridge saw significant increases.
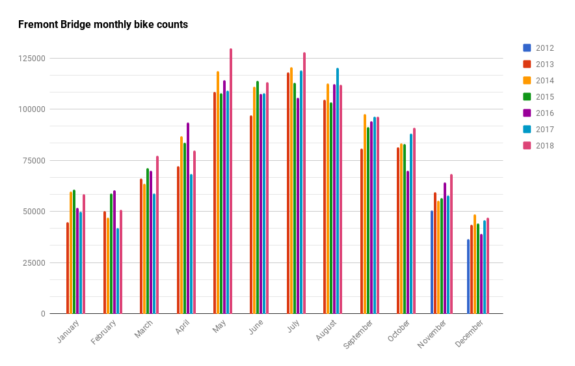
 Fremont shattered the previous record, reaching 1,051,893 trips. That's a nine percent increase over 2017. Since so many north end Seattle and regional bike routes funnel to the Fremont Bridge, this is probably the single best point to get a snapshot of biking in the city. And because it is so busy, it takes a huge number of trips to move the needle. Since 2014, year-over-year changes have been within two percent of each other. So a nine percent increase is massive.
The West Seattle figures are little more tricky to figure out. Looking at raw numbers, the 2018 count was a modest three percent increase over 2017. But emergency work on the swing bridge closed the route for several days in June and the counter was down for several days in November. I tried to fill in the missing data using counts from days before and after the gaps and determined that maybe 7,000 trips were either missed or displaced. So the bridge was actually on pace for a five or six percent increase over 2017.
I'm sure there are people out there who are confused because this data seems to suggest the opposite of recently-reported Census data, which showed bike commuting declining or stagnating in Seattle. A recent USA Today story even highlighted Seattle as part of what appears to be a national trend away bike commuting. We wrote about the Census survey results previously, but I feel the need to address it again here.
I don't believe the Census data is wrong. I just think the question they are asking (and the way they ask it) is not complete enough to give an accurate picture of transportation use in increasingly multimodal cities. Recent expansions of bike share and express transit service both encourage people to mix trips by biking to transit, for example. The Census survey only allows a single mode as a respondent's primary mode of travel to work. So someone who bikes to UW Station then takes light rail the rest of the way is likely counted as a transit rider, for example. Someone who takes transit downtown, but then grabs a bike share to get the rest of the way to work is also likely counted as a transit rider. Transit ridership has grown significantly in recent Census surveys, and it's quite likely that a lot of those new riders got to their stations or bus stops by bike.
People who bike some days - but not always - are likely not counted as bike commuters, either. The question also does not account for non-work trips, which make up the majority of all trips.
So it's entirely possible for the Census bike commute rate to go down or stagnate while the total counted bike trips go up. And bike trips are the more important measure, since it really does not matter why someone is biking. We just do not have a quality dataset that accounts for all trips regardless of purpose or mode mixing, so people focus on the Census commute figures.
It's also worth noting that the most recent Census data is for 2017, so it will be interesting to see how/if things change in the 2018 data. But that won't be out until September.
This is a long-winded way of saying that more people are biking more trips in Seattle. And expanding the bike network and growing bike share both help people make more bike trips. And making big bike network improvements, especially downtown, can yield big results in a very short period of time. At a time when the city is bracing for years of traffic headache, an expanded and connected bike network could be an effective pressure release valve to keep people moving. Seattle leaders should celebrate this success and build on it.