Fixing Random, part 37
Last time on FAIC we finally wrote a tiny handful of lines of code to correctly implement importance sampling; if we have a distribution p that we're sampling from, and a function f that we're running those samples through, we can compute the expected value of f even if there are "black swan" regions in p. All we need is a helper distribution q that has the same support as p, but no black swans.
Great. How are we going to find that?
A variation on this problem has come up before this series: what should the initial and proposal distributions be when using Metropolis? If we're using Metropolis to compute a posterior from a prior then we can use the prior as the initial distribution. But it's not at all clear in general how to choose a high-quality proposal distribution; there's some art there.
There is also some art in choosing appropriate helper distributions when doing importance sampling. Let's once again take a look at our "black swan" situation:
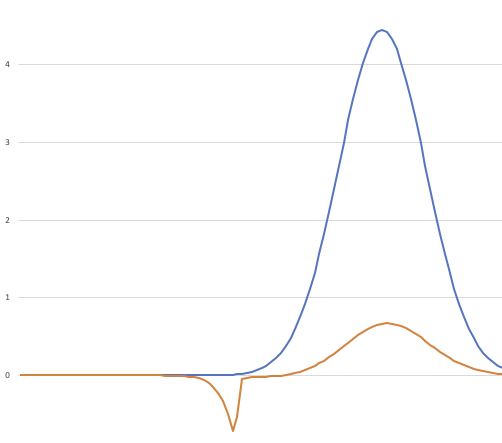
As we've discussed, I contrived the "black swan" situation by ensuring that there was a region of the graph where the orange line bounded a large area, but the blue line bounded a very tiny area there.
First off: in my initial description of the problem I made the assumption that I only cared about the function on the range of 0.0 to 1.0. If you know ahead of time that there is a specific range of interest, you can always use a uniform distribution over that range as a good guess at a helper distribution. As we saw in a previous episode, doing so here gave good results. Sure, we spend a lot of time sampling a region of low area, but we could tweak that to exclude the region between 0.0 and 0.3.
What if we don't know the region of interest ahead of time though? What if the PDF and the function we're evaluating are defined over the whole real line and we're not sure where to put a uniform distribution? Let's think about some quick-and-dirty hacks for solving that problem.
What if we "stretched" the blue line a little bit around 0.75, and "squashed" it down a little bit?

The light blue line is not perfect by any means, but we are now likely to get at least a few samples from the part of the orange line that has large negative area.
Since the original distribution is just a normal, we can easily make this helper distribution by increasing the standard deviation. (Code for this episode can be found here.)
var p = Normal.Distribution(0.75, 0.09);
var p2 = Normal.Distribution(0.75, 0.15);
double f(double x) => Atan(1000 * (x - .45)) * 20 - 31.2;
for (int i = 0; i < 10; ++i)
Console.WriteLine(
$"{p.ExpectedValueByImportance(f, 1.0, p2):0.###}");
0.119, 0.114, 0.108, 0.117, 0.116, 0.108, 0.121, ...
Recall that the correct value is 0.113. This is not perfect, but it's a lot better than the original.
Now, it is all well and good to say that we know how to solve the problem when the nominal distribution is normal; what if it is some arbitrary distribution and we want to "stretch" it?
That's actually pretty straightforward. Let's suppose we want to stretch a distribution around a particular center, and, optionally, also move it to the left or right on the real line. Here's the code:
public sealed class Stretch : IWeightedDistribution<double>
{
private IWeightedDistribution<double> d;
private double shift;
private double stretch;
public static IWeightedDistribution<double> Distribution(
IWeightedDistribution<double> d,
double stretch,
double shift = 0.0,
double around = 0.0)
{
if (stretch == 1.0 && shift == 0.0) return d;
return new Stretch(
d, stretch, shift + around - around * stretch);
}
private Stretch(
IWeightedDistribution<double> d,
double stretch,
double shift)
{
this.d = d;
this.stretch = stretch;
this.shift = shift;
}
public double Sample() =>
d.Sample() * stretch + shift;
// Dividing the weight by stretch preserves
// the normalization constant
public double Weight(double x) =>
d.Weight((x - shift) / stretch) / stretch;
}
And now we can get similar results:
var p = Normal.Distribution(0.75, 0.09);
var ps = Stretch.Distribution(p, 2.0, 0, 0.75);
double f(double x) => Atan(1000 * (x - .45)) * 20 - 31.2;
for (int i = 0; i < 10; ++i)
Console.WriteLine(
$"{p.ExpectedValueByImportance(f, 1.0, ps):0.###}");
0.113, 0.117, 0.121, 0.124, 0.12 ...
Again, not perfect, but we're getting at least reasonable results here.
But like I said before, these are both "more art than science" techniques; they are useful if you have a particular distribution and a particular function, and you're looking for an expected value, and you're willing to spend some time writing different programs and trying out different techniques and parameters to tweak it to get good results. We still have not got an algorithm where a distribution and a function go in, and an accurate estimate of the expected value comes out.
Next time on FAIC: I'll make one more attempt at writing code to get a good result automatically that will fail for reasons I do not know, and sketch out a much more sophisticated algorithm but not implement it.