Distribution of zip code population
There are three schools of thought regarding power laws: the naive, the enthusiasts, and the skeptics. Of course there are more than three schools of thought, but there are three I want to talk about.
The naive haven't heard of power laws or don't know much about them. They probably tend to expect things to be more uniformly distributed than they really are.
The enthusiasts have read books about fractals, networks, power laws, etc. and see power laws everywhere.
The skeptics say the prevalence of power laws is overestimated.
Within the skeptics are the pedants. They'll point out that nothing exactly follows a power law over the entirety of its range, which is true but unhelpful. Nothing follows any theoretical distribution exactly and everywhere. This is true of the normal distribution as much as it is true of power laws, but that doesn't mean that normal distributions and power laws aren't useful models.
Guessing the distributionIf you asked a power law enthusiast how zip code populations are distributed, their first guess would of course be a power law. They might suppose that 80% of the US population lives in 20% of the zip codes, following Pareto's 80-20 rule.
The enthusiasts wouldn't be too far off. They would do better than the uniformitarians who might expect that close to 20% of the population lives in 20% of the zip codes.
It turns out that about 70% of Americans live in the zip codes in the top 20th percentile of population. To include 80% of the population, you have to include the top 27% of zip codes.
But a power law implies more than just the 80-2o rule. It implies that something like the 80-20 rule holds on multiple scales, and that's not true of zip codes.
Looking at plotsThe signature of a power law is a straight line on a log-log plot. Power laws never hold exactly and everywhere, but a lot of things approximately follow a power law over a useful range, typically in the middle.
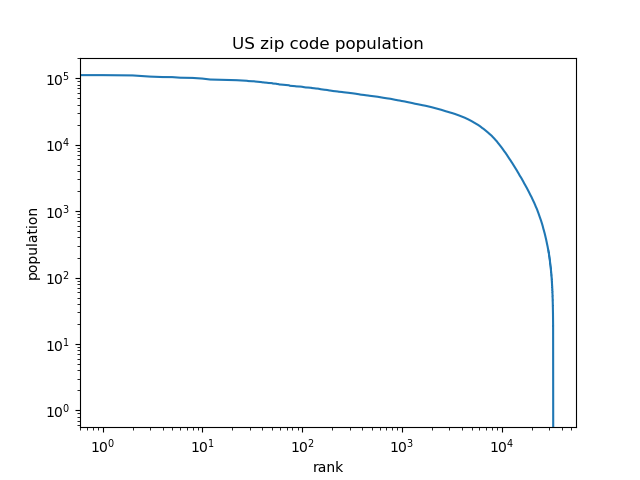
What do we get if we make a log-log plot of zip code population?

This looks more like a squircle than a straight line.
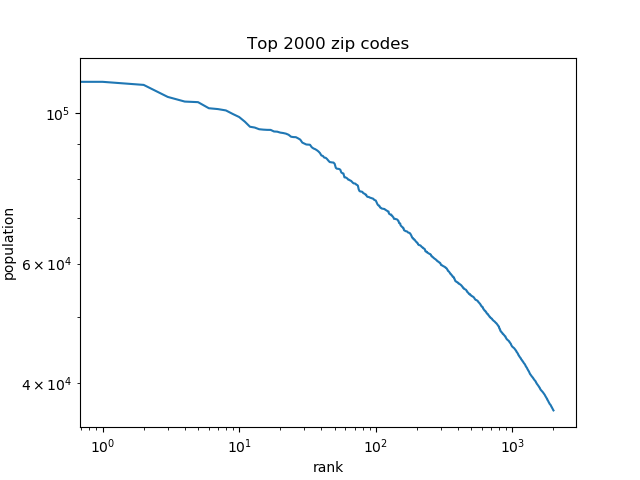
If we zoom in on just part of the plot, say the largest 2,000 zip codes [1], we get something that has a flat spot, but plot bows outward, and continues to bow outward as we zoom in on different parts of it.

Why is the distribution of zip code populations not a power law? One reason is that zip codes are artificial. They were designed to make it easier to distribute mail, and so there was a deliberate effort to make them somewhat uniform in population. The population of the largest zip code is only 12 times the average.
You're more likely to see power laws in something organic like city populations. The largest city in the US is nearly 1,400 larger than the average city [2].
Another reason zip code populations do not follow a power law is that zip codes are somewhat of a geographical designation. I say "somewhat" because the relationship between zip codes and geography is complicated. See [1].
But because there's at least some attempt to accommodate geography, and because the US population is very thin in large regions of the country, there are many sparsely populated zip codes, even when you roll them up from 5 digits to just 3 digits, and that's why the curve drops very sharply at the end.
Related posts- Identification using birthday, sex, and zip code
- Passwords and power laws
- Estimating power law exponents
[1] This post is based on ZCTAs (Zip Code Tabulation Areas) according to the 2010 census. ZCTAs are not exactly zip codes for reasons explained here.
[2] It depends on how you define "city," but the average local jurisdiction population in the United States is around 6,200 and the population of New York City is around 8,600,000, which is 1,400 times larger.