Seattle’s 2019 bike boom in 6 charts + Where should Seattle’s next bike counters go? – UPDATED
UPDATE: I have updated some of the data in this post with official numbers from SDOT. An earlier version of this post had data from data.seattle.gov that for some reason didn't match with SDOT's official numbers. As of this update, much of the data.seattle.gov figures now match SDOT's numbers. The 2nd Ave section of this post has been changed most dramatically.
 The counts are in, and Seattle didn't just see increases in biking, the city absolutely smashed all previous biking records. We leveled up.
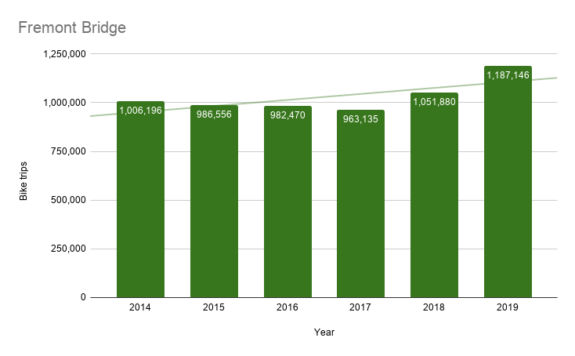
We've already written several times (and even made a video) about what happened this year on the Fremont Bridge. So many citywide and regional bike routes converge at this bridge that it sees the highest counts of any other single counting point in town. So it is an exciting point to track.
And the physical display ticking away in real time helps give people the feeling that they are part of something bigger. A number readout shows the counts that day while a thermometer-style gauge tracks the counts for the calendar year. Though perhaps Cascade Bicycle Club made a mistake in 2014 when they donated a counter that only goes to 1 million because Seattle topped out in October this year, months earlier than ever before. The grand total: 1,187,146.
 So I wondered, was this just a Fremont Bridge or North Seattle thing? Unfortunately, we don't have high quality data from all parts of the city. SDOT installed many low-budget counters years ago that have since gone dark due to vandalism or mechanical failure, so they are of little help. But we do have six counters in the city that are ticking away and have what should be mostly consistent and quality data (though it is harder to trust counters that don't have the real-time displays, which also help make sure people are counted properly). The charts in this post use information directly from data.seattle.gov SDOT, and I did look for major data gaps (at least a month in duration) so I could note them. I also removed the walking counts for the counters that track both walking and biking (though, hey, someone could have fun analyzing that data, I'm sure). Let's take a look.
 The Spokane Street Swing Bridge to West Seattle also hit a new record at 321,809, bolstered by a massive spike in biking to get around the viaduct closure at the start of the years. And a lot of those riders stuck around for the year, helping increase the annual count by 10% over 2018. The bridge riders even beat the 2015 record by 7%, finally reaching bike numbers the bridge hasn't seen since before Viaduct construction hell began. 2019's increase was truly led by the community getting together, getting organized and doing what they could to encourage and help their neighbors bike around the construction traffic. Seattle Bike Blog doesn't give out awards, but if we did West Seattle Bike Connections would get one this year, that's for sure.
West Seattle's bike numbers aren't going to balloon until E Marginal Way has safe, connected bike lanes and the waterfront bike routes at least connect West Seattle to downtown. The intersection of Chelan Ave SW and the Alki Trail also needs a total and complete reworking. This one awful intersection is holding the entire Alki Trail back because it's difficult to avoid and can be really scary and intimidating, especially to new riders.

* Elliott Bay Trail's 2015 data is missing about a month of springtime counts.
The Elliott Bay Trail saw a dip in 2019 set a record in 2019 despite the year of construction that detoured a major section of the trail around Expedia's future campus. I had actually expected to see a dip in the counts here. While the detour wasn't too bad (and many commuters found that it was actually a little shorter), this work certainly made this route less appealing for purely recreational rides.
But we aren't going to see massive increases on this trail until it connects to a safe and complete waterfront bike route. Couple that with a safe Ballard Bridge (and improvements through the rail yard), and I bet these counts would be higher than Fremont.
Backup counter reveals issue with 2nd Ave countsTake these charts with a big grain of salt:
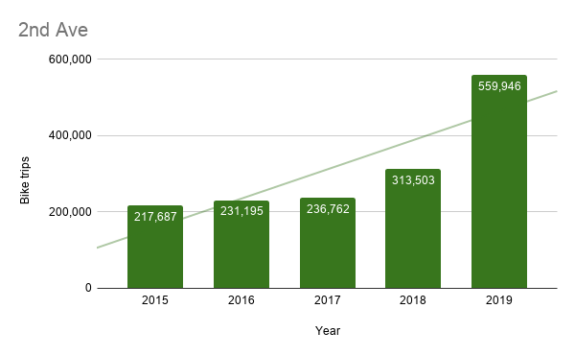
UPDATE: Bike trips on 2nd Ave reached an official count of 559,946 in 2019, up a suspicious 79% over 2018. While that kind of increase would cool, there is just no way it is true. "Backup tube counts were picking up platoons of riders that permanent counter was missing," SDOT Traffic Engineer Dongho Chang noted on Twitter. So the good news is that the 2019 figure should be closer to the truth. The bad news is that we cannot really compare 2019 to previous years (well, not without some fancy math to compensate for the change in counting accuracy, anyway).
I suspect 2nd Ave increased at a year-over-year rate somewhat comparable to the Fremont Bridge's still very impressive 13%. As you can see in the monthly counts chart, the 2019 counts were on track for a more modest increase in winter and early spring, but then shot through the roof in May, nearly doubling the year before. That's highly unlikely. And I no longer feel confident in what this data says to draw definitive conclusions. I think biking is up, but I can't tell you that the data definitively says so on 2nd Ave.
Oh boy. Note that the Belltown extension of the 2nd Ave bike lane opened at the very start of 2018. You can obviously see the impact that extension had on cycling numbers in 2018. This was one of the so-called "$12 million per mile" bike lanes (the bike lane itself cost only a part of that, with the rest going to improvements for all modes like new and upgraded traffic signals, utility work and pavement fixes).
And remember that when the city first opened the 2nd Ave pilot bike lane back in 2014, biking on the street tripled over night. I had expected it to double, since a one-way was becoming two-way, but I'm not sure many people expected it to triple. So yeah, the 2nd Ave bike lane projects have been pretty great investments for our city.
The 520 Bridge changes Eastside biking patternsFor decades, you had three choices if you were going from the Eastside to Seattle: North of the lake, south of the lake or I-90. So the next two charts are connected to one major event: The opening of the 520 Trail across Lake Washington in January 2018. However, I do not have the 520 Trail bike counter data yet, so we'll need to see if we can see the opening's impact on the north end of the Burke-Gilman Trail and the I-90 Trail.

* The Mountains to Sound Trail's 2016 data is missing about a month of summertime counts.
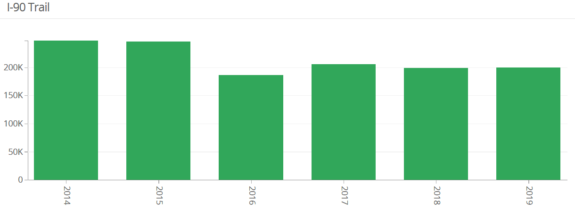
First, note that the 2016 I-90 Trail data is not at all accurate because it is missing at least a month of summertime counts. So actual biking levels would likely either put it similar to 2015 or somewhere between 2015 and 2017.
2017 saw record-levels of rain and a smokey summer, and nearly all counters showed a dip that year. But 2018 and 2019 were almost certainly down for a very different reason: People diverting to the 520 Bridge instead.
The 200,437 trips in 2019 were down 19% compared to 2015's record of 247,706. But there is no doubt that this gap is more than made up by the big increases in cross-lake biking the 520 Bridge has made possible. Stay tuned, because I will update when I get the 520 numbers. But trust me, they will be a lot higher than 47,000.
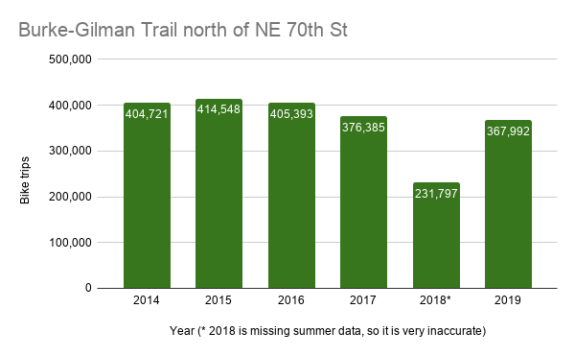
Again, note that the 2018 counts are not accurate because they are missing pretty much all of summer. So it's best to just assume that it fits along a trend line between the other years.
At first you might be surprised to see that the city's premiere trail saw a dip in use in 2019 compared to 2017 and earlier. 2019's total of 367,992 is 11% below 2015's record of 414,548. How can this be when the other counters in the city are seeing such big increases?
Again, it's almost certainly the 520 Bridge. This counter is located north of NE 70th Street, so that's just beyond the bike routes to Magnuson Park. So this count relies a lot on regional travel, much different than if it were located near the busier sections like around Gas Works Park, for example. And it is just so much faster for much of Seattle to get to, say, Redmond or Kirkland or downtown Bellevue by going over the 520 Bridge than by going around the lake. From the UW, you save more than a half hour by taking the bridge to Redmond even if you are already on the Burke-Gilman.
So yeah, a ton of riders diverted to the bridge. And though I don't yet have the 520 counts, I am sure they more than make up for this dip. I'm sure they make up for the I-90 and Burke-Gilman Trail dips combined. So don't look at these charts and say, "Well, bike counts are mixed." Cross-lake biking is almost certainly way up, I just don't have the chart I need to show you where the missing riders went.
We need more counters, especially in SE SeattleAnd this brings us to the problem with Seattle's bike counters: We only know what we count, but we don't count everywhere. And though the city used to have more counters, we never had a good measure of SE Seattle biking (the long-dead Chief Sealth Trail bike counter was not in a good location to capture biking trends, anyway). This is the big problem with relying on data for civic decisions: Only those who are counted count. And if we keep investing primarily to improve areas where we have measured bike increases, then we will keep investing inequitably and widening the gap between how north Seattle and south Seattle are treated.
So yes, we need more bike counters in the southend. But there's another problem: We need quality, separated bike routes where we can put these counters. Right now, there are few quality locations for a bike counter that would capture S and SE Seattle biking trends. If there were bike lanes on Rainier Ave or MLK, we could put a counter there. If Lake Washington Boulevard had a protected bikeway, that would be a great place, too. Jose Rizal Bridge bike lanes would also be a great spot, if those existed.
As it is, there is just no way to say whether SE Seattle biking has increased the way north Seattle has, at least not by using bike counter data. And even if SDOT went out today and installed a bike counter on, say, the new 5th Ave S bike lane next to International District/Chinatown Station, it will take up to two years to gather enough data to really see how biking trends are going.
I doubt SDOT has the budget to buy and install new bike counter totems like the ones on the Fremont and Spokane Street Bridges, but those were donated by Cascade Bicycle Club. So if anyone has connections to local businesses or organizations that would want to sponsor some new bike totems, that would be a wonderful gift to the city.
Of course you want to put bike counters where people are already biking. Pinch points are best because you can get a lot of routes at once. But you can also use bike counters in places where we want to invest to grow cycling. That way we can see whether the investments are working.
Some location ideas:
- 5th Ave S near ID Station
- Lake Washington Boulevard bike lanes south of Rainier Beach
- Jose Rizal Bridge (as part of the planned bike improvements scheduled for 2020)
- S Dearborn Street
- Sodo Trail near Stadium Station
- Georgetown to South Park Trail when it is constructed (perhaps the South Park Bridge is the best location?)
- Linden Ave N bikeway (Interurban North bike route)
- Burke-Gilman Trail on UW campus (to better understand school year travel trends)
- Union Street as part of the planned protected bike lanes
- Pike and Pine at I-5 to better understand cross-freeway travel
- Thomas Street as part of the planned remake when it connects SLU to Seattle Center
- The downtown waterfront bikeway when it is finally constructed someday
Do you have another other count location ideas? Let us know in the comments below.
EDITOR'S NOTE: The Seattle Times published a story on the bike counter data earlier today, and some of their numbers don't match what I found. For example, they noted that Spokane Street numbers were down in 2019, but that's not what I found. SDOT Traffic Engineer Dongho Chang also tweeted out a different set of numbers for 2nd Ave than what is on data.seattle.gov. I'll update this post when I figure out why the numbers don't match up.


