Where 2018’s bicycle collisions happened + More from the Traffic Report
 Biking is getting gradually safer in Seattle with the rate of collisions involving people on bikes per bike commuter dropping to a new low point in 2018, according to the annual Seattle Department of Transportation Traffic Report.
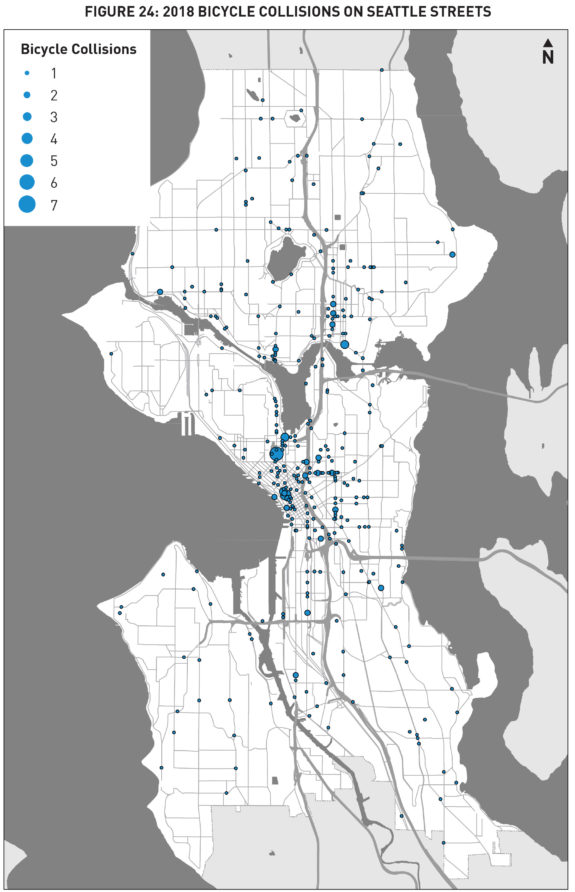
The report, released two weeks ago, does not include any 2019 data. It offers a detailed look at transportation trends in the city, including safety. Here are the streets where collisions involving people on bikes occurred:
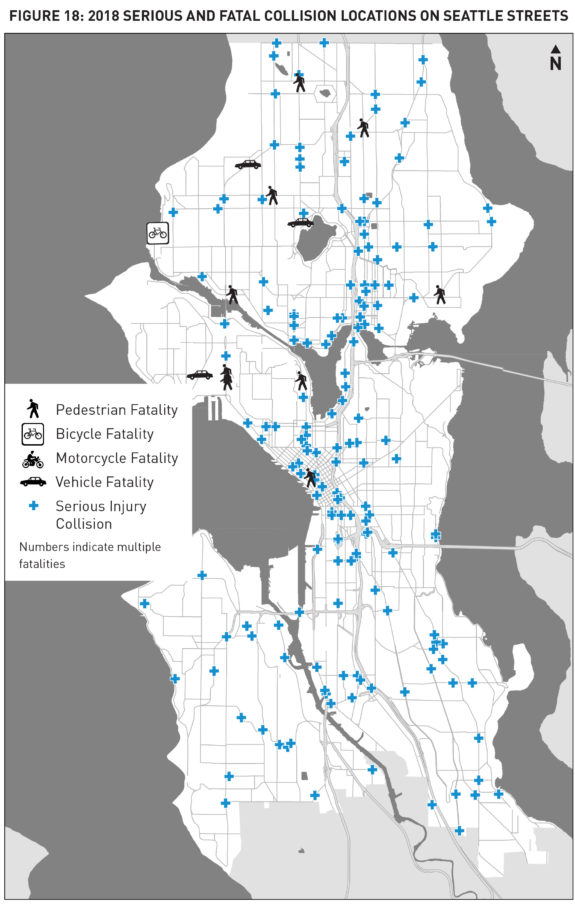
 And here's a map of the year's serious injury and fatal collisions:
 The share of commuters driving alone to work is dropping fast with transit and walking growing fastest.
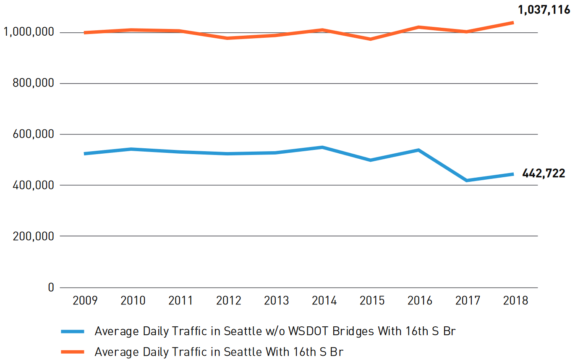
 But Seattle's population keeps growing, so even as the driving rate falls, the total amount of driving stays stubbornly flat.
 Driving, of course, is our city's top source of greenhouse gas emissions. So while it is promising that total driving is not growing with the population, we need to find a way to reduce driving even as the city grows. Perhaps Oslo has some ideas to share.
You see more in the full report (PDF).