Plotting complex functions
by John from John D. Cook on (#4Z86T)
I wrote a blog post of sorts, spread over several tweets, about plotting functions of a complex variable.
Plot of cosine over a square centered at the origin of the complex plane.
Color = phase. Height = magnitude. pic.twitter.com/rOT7tAkfM9- Analysis Fact (@AnalysisFact) February 11, 2020
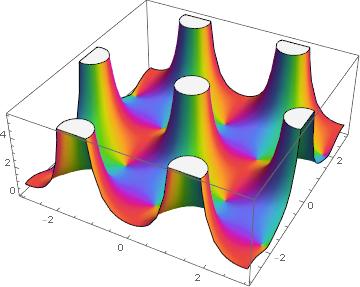
Here are a couple of the images from the tweet stream. First Weierstrass's elliptic function.

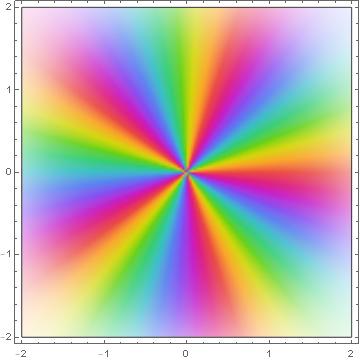
And a phase plot for z5.

- Denver airport and Weierstrass a
- Analogies between Weierstrass functions and trig functions
- Uniform approximation paradox