Plotting the Gauss map
A recent post looked at an example from one of Michael Trott's tomes. This post looks at another example from the same tome.
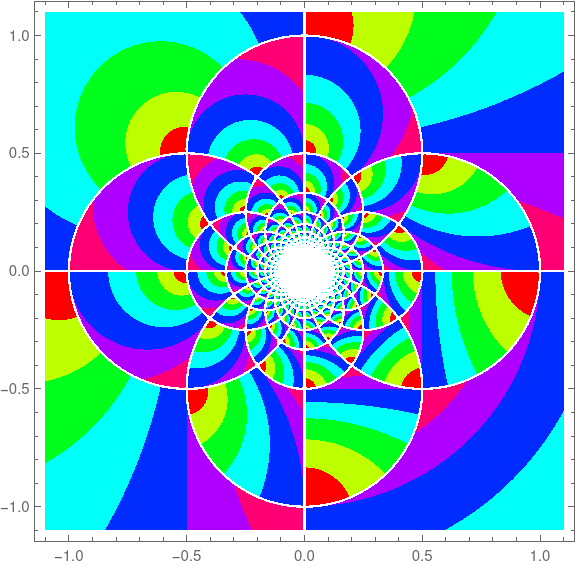
Trott made a contour plot of the Gauss map
over the complex plane. I copied his code (almost) and reproduced his plot.
ContourPlot[ Abs[1/(x + I y) - Floor[1/(x + I y)]], {x, -1.1, 1.1}, {y, -1.1, 1.1}, PlotPoints -> 40, ColorFunction -> Hue, ContourStyle -> {Thickness[0.00001]} ]This produced the following image.

The original code set PlotPoints to 400, and it was taking forever. I got impatient and set the parameter to 40. Looking at the image in the book, it seems the plot with the parameter set to 400 is very similar, except there's a black tangle in the middle rather than a white space.
In 2004 when Trott wrote his book, Mathematica did not have a command for plotting functions of a complex variable directly, and so Trott rolled his own as a function of two real variables.
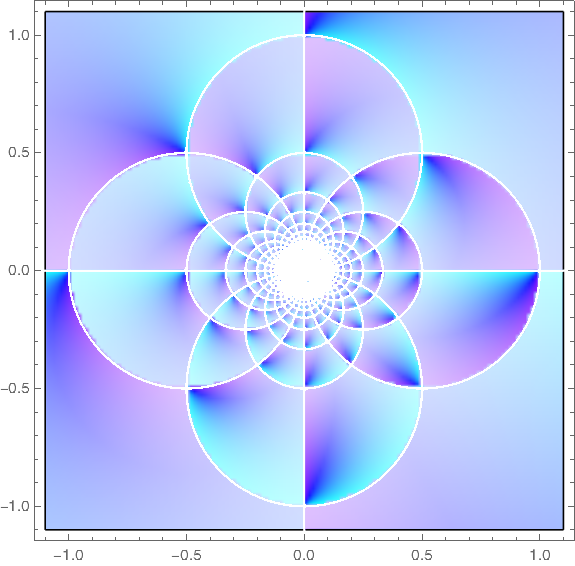
Here's a plot of the same function using the relatively new ComplexPlot function.

Here's the code that produced the plot.
ComplexPlot[ (1/z - Floor[1/z]), {z, -1.1 - 1.1 I, 1.1 + 1.1 I}, ColorFunction -> Hue, PlotPoints -> 400 ]UpdateWhat does it mean to apply the floor function to a complex number? See the next post.
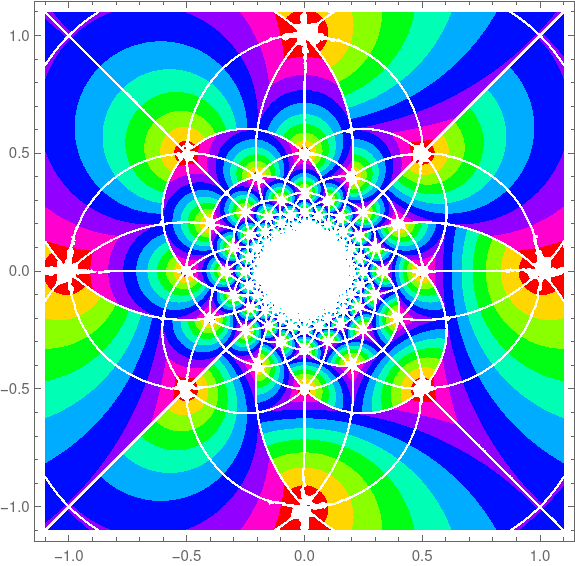
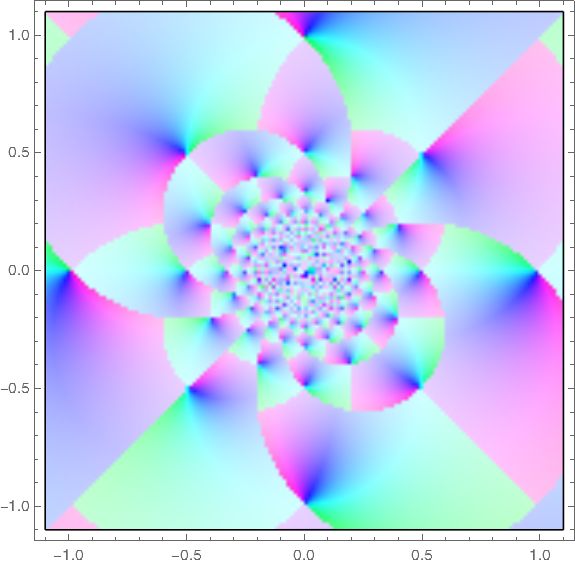
The plots above were based on Mathematica's definition of complex floor. Another definition gives different plots.
aplfloor[z_] := With[ {x = Re[z] - Floor[Re[z]], y = Im[z] - Floor[Im[z]], g = Floor[z]}, If[x + y > 1, If[x >= y, g + 1, g + I], g]]This leads to different plots of the Gauss map.
Vintage:

And new style:
