The tent map
Yesterday I said that Lyapunov exponents can't be calculated exactly except in the case of toy problems. One such toy model is the tent map.
The graph of function on the right hand side looks a tent. It's zero at x = 0 and at x = 1 and rises to a height of r in the middle. The Lyapunov exponent of this system has been calculated [1] to be
= log 2r.
For r < 1/2 the Lyapunov exponent is negative and the system is stable.
For r > 1/2 the Lyapunov exponent is positive and the system is chaotic. The larger r is, the faster uncertainty in the future values of x grows. In fact the uncertainty grows in proportion to (2r)n.
Suppose r = 1 and we know the floating point representation of x0. Suppose we compute the iterations of the tent map exactly. There is no rounding error, and the only uncertainty comes from the initial uncertainty in x0. Assuming we're using an IEEE 754 double precision number, our initial uncertainty is 2-53. (See details here.)
We lose one bit of precision in the value of x at each iteration. After 53 iterations, we've lost all information: the true value of x53 could be anywhere in [0, 1], and our calculated value gives us no clue where in the interval x actually is.
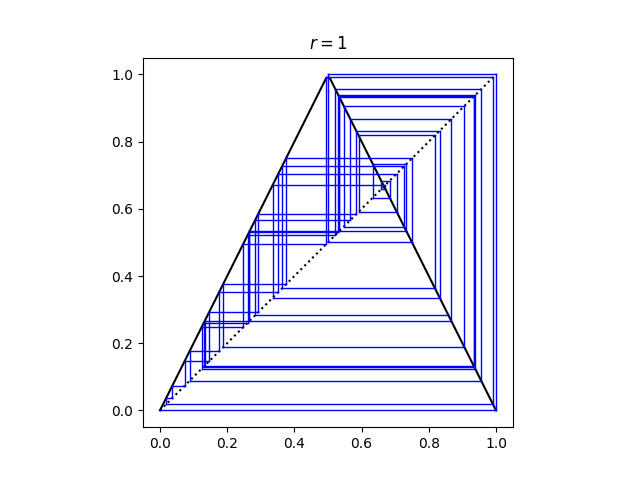
Here's a cobweb plot of the iterations starting with x0 = 4 - .

The solid black lines are the tent map. Vertical lines connect each iterate to its next value. Horizontal lines bring each iterate back to the line y = x to start the next iteration.
Incidentally, after 49 iterations the computed value x reaches 0 and stays there. This would not happen if we started with exactly x0 = 4 - and carried out each iteration in exact arithmetic because then all the values of x are irrational.
[1] Lichtenberg and Lieberman. Regular Stochastic Motion. Springer-Verlag 1983.
The post The tent map first appeared on John D. Cook.