U.S.’s Natural Gas-Fired Power Plants Set Daily Production Records in July Despite High Fuel Prices

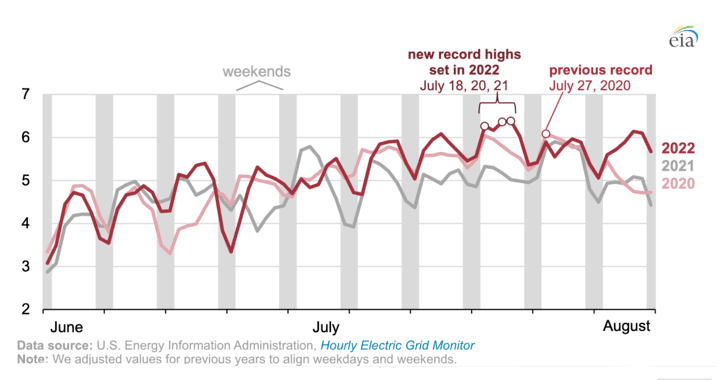
The U.S. Energy Information Administration (EIA) reported that electricity generated by natural gas-fired power plants in the lower 48 states reached 6.37 TWh on July 21, setting a new record high for a day.
In fact, the previous high, set on July 27, 2020, was broken three times during that week in July, first on the 18th, then that record was broken on the 20th, which was subsequently broken the following day (Figure 1). Gas prices, however, are markedly higher today compared to when the 2020 record was set.
 1. This chart shows the daily U.S. natural gas-fired electricity generation (in TWh) for selected weeks in 2020-2022. Source: EIA
In July 2020, the Henry Hub natural gas price, which is a commonly used benchmark, averaged $1.77/MMBtu, according to the EIA. This July, the natural gas price averaged $7.28/MMBtu. Typically, a higher natural gas price reduces the competitiveness of gas-fired generation relative to other sources, making it less attractive, but this year producers are continuing to find reasons to operate gas plants.
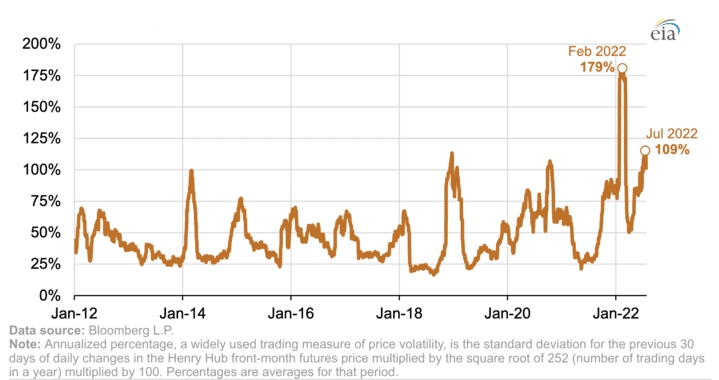
The EIA said gas prices have been more volatile this year than they've been at any other time over the past 20 years (Figure 2). The 30-day historical volatility of U.S. natural gas prices averaged 179% in February compared with 57% during the first quarter of 2021. The annualized percentage, which is a widely used trading measure of price volatility, is calculated using the standard deviation for the previous 30 days of daily changes in the Henry Hub front-month futures price multiplied by the square root of 252 (the number of trading days in a year) multiplied by 100. Percentages are averages for a given period.
 2. This chart shows the natural gas 30-day historical volatility as an annualized percentage from January 2012 through July 2022. Source: EIA
Increased uncertainty about market conditions that affect natural gas supply and demand can result in high price volatility. The EIA said the following events have contributed to changing market conditions:
- Production freeze-offs.
- Storms.
- Unplanned pipeline maintenance and outages.
- Significant departures from normal weather.
- Changes in inventory levels.
- Availability of substitute fuels.
- Changes in imports or exports.
- Other sudden changes in demand.
During July, the EIA said historical volatility was lower on a percentage basis, in part, because natural gas prices were relatively higher than during the first quarter of the year. It said, U.S. natural gas prices are typically more volatile during the first quarter of a year because of the fluctuating demand for natural gas for space heating as weather changes." Factors that contributed to heightened volatility in the first three months of 2022 include:
- Weather-driven fluctuations in natural gas demand.
- Declining natural gas production in January and February.
- Declining natural gas storage in the Lower 48 states.
- Record U.S. liquefied natural gas (LNG) exports to Europe to help offset reduced natural gas supplies from Russia.
Although official power generation data for July have not yet been released, the EIA said coal-fired power plants have not been used as much this summer as in prior summers. The most recent numbers show coal-fired generation was down about 16.2% in June this year compared to 2021. Continued retirements of coal-fired generating plants, relatively high coal prices, and lower-than-average coal stocks at power plants have limited coal consumption, the EIA said. In May, coal inventories at power plants averaged 20% less than the prior-year levels.
Furthermore, new capacity has increased the availability and use of natural gas-fired generation. Over the past 10 years, developers have added about 62 GW of combined cycle gas turbine capacity, the EIA said. Data through the first half of the year shows that gas-fired generation is up more than 5.5% this year compared to 2021, though it remains slightly less than during the same period in 2020, which was a record-setting year for gas.
-Aaron Larson is POWER's executive editor (@AaronL_Power, @POWERmagazine).
The post U.S.'s Natural Gas-Fired Power Plants Set Daily Production Records in July Despite High Fuel Prices appeared first on POWER Magazine.