Robustness of mean range
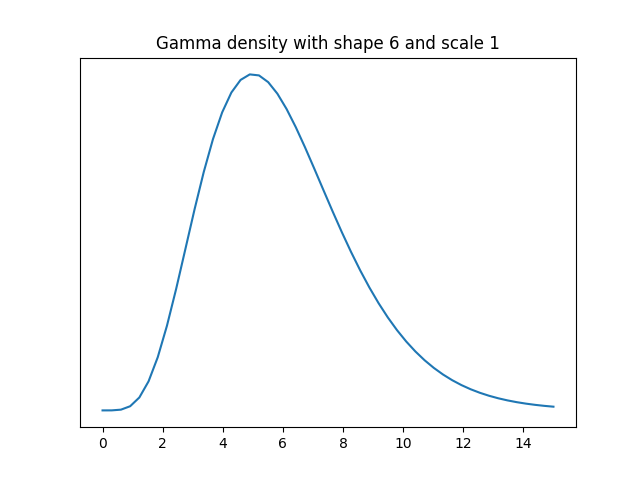
Let's suppose we have data that comes from a distribution that is approximately normal but has a heavier right tail, specifically a gamma distribution with shape 6.

We'd like to estimate the standard deviation of the data source. If the data were normally distributed, the sample standard deviation would be the most efficient unbiased estimator. But what about this example where the data are roughly normally distributed? How well does sample standard deviation compare to the mean range? Following the convention of ANSI Z1.4 we'll average the ranges of samples of 5.
The variance of a gamma random variable with scale 1 is equal to its shape parameter, so our data has variance 6, and so standard deviation 6. We will pretend that we don't know this and see how well we can infer this value using random samples. We'll compare the statistical efficiency of the mean of the ranges of k samples of 5 each and the standard deviation based on 5k samples for k = 2 and 4.
First we'll use the following code to estimate the population standard deviation with 10 samples two ways: with sample standard deviation and with the average of the range of two samples of 5. We'll take the absolute value of the difference between each estimate and the true value, and repeat this 1,000 times to simulate the mean absolute error.
from scipy.stats import gamma, t def meanrange(y, k): scale = 0.430 # scale factor for n=5 s = 0 for i in range(k): sample = y[5*i:5*(i+1)] s += max(sample) - min(sample) return scale*s/k n = 5 k = 2 shape = 6 sigma = shape**0.5 stderr = 0 mrerr = 0 N = 1000 for _ in range(N): y = gamma(shape).rvs(size=n*k) std = y.std(ddof=1) mr = meanrange(y, k) stderr += abs(std-sigma) mrerr += abs(mr-sigma) print(stderr/N, mrerr/N)
The mean absolute error was 0.532 using sample standard deviation and 0.550 using mean range.
When I changed k to 4, the mean absolute error using the sample standard deviation was 0.377. The mean absolute error using the range of 4 samples of 5 each time was 0.402.
The error in both methods was comparable, though the sample standard deviation did slightly better.
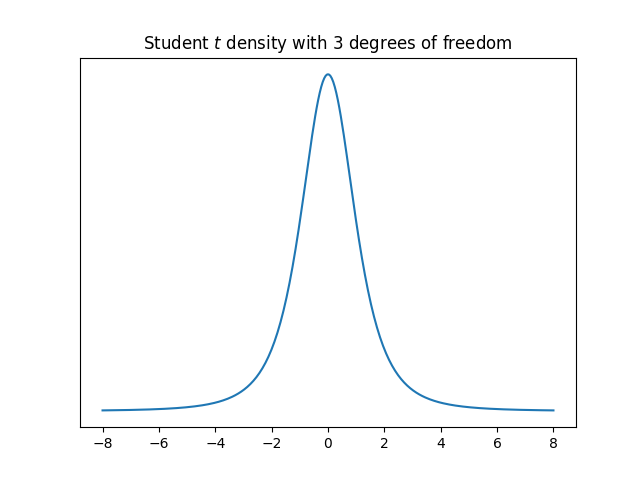
Next I repeated the experiment drawing samples from a Student t distribution with 3 degrees of freedom, a distribution with heavy tails.

When k = 2, the mean absolute errors were 0.603 and 0.574 for sample standard deviation and mean range respectively. When k = 4, the errors were 0.484 and 0.431. Again the errors are comparable, but this time the mean range was more accurate.
Related posts- Robustness of the two-sample t test
- Measuring graph robustness
- Robust in one sense, sensitive in another