Bean Machine Retrospective, part 1
As I mentioned in the previous episode, the entire Bean Machine team was dissolved; some team members were simply fired, others were absorbed into other teams, and some left the company. In this series I'm going to talk a bit about Bean Machine and my work on what is surely the strangest compiler I've ever written.
I should probably recap here my introduction to Bean Machine from what now seems like an eternity ago but was in fact only September of 2020.
We also have some tutorials and examples at beanmachine.org, and the source code is at github.com/facebookresearch/beanmachine.
We typically think of a programming language as a tool for implementing applications and components: games, compilers, utilities, spreadsheets, web servers, libraries, whatever. Bean Machine is not that; it is a calculator that solves a particular class of math problems; the problems are expressed as programs.
The purpose of Bean Machine is to allow data scientists to write declarative code inside Python scripts which represents relationships between parts of a statistical model, thereby defining a prior distribution. The scientist can then input real-world observations of some of the random variables, and queries on the posterior distributions. That is, we wish to give a principled, mathematically sound answer to the question: how should we update our beliefs when given real-world observations?
Bean Machine is implemented as some function decorators which modify the behavior of Python programs and some inference engines which do the math. However, the modifications to Python function call semantics caused by the decorators are severe enough that it is reasonable to conceptualize Bean Machine as a domain specific language embedded in Python.
The hello world" of Bean Machine is: we have a mint which produces a single coin; our prior assumption is that the fairness of the coin is distributed somehow; let's suppose we have reason to believe that it is drawn from beta(2,2).
@random_variabledef fairness(): return Beta(2,2)
We then flip that coin n times; each time we call flip with a different argument represents a different coin flip:
@random_variabledef flip(n): return Bernoulli(fairness())
We then choose an inference algorithm - say, single-site Metropolis - say what we observed some coin flips to be, and ask for samples from the posterior distribution of the fairness of the coin. After all, we have much more information about the fairness of the coin after observing some coin flips than we did before.
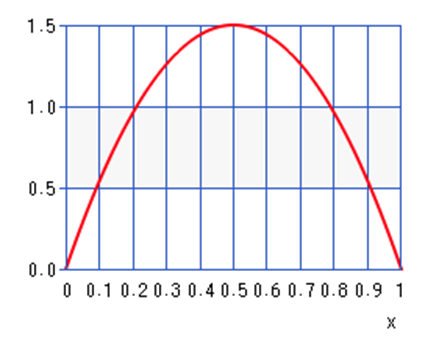
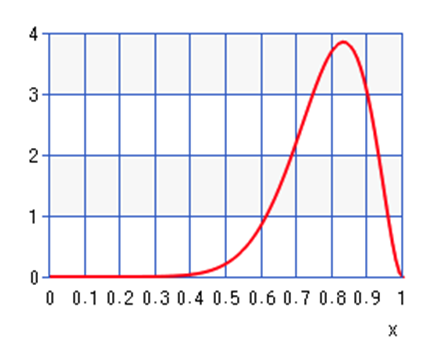
heads = tensor(1)tails = tensor(0)samples = bm.SingleSiteAncestralMetropolisHastings().infer( queries=[fairness()], # Say these are nine heads out of ten, for example. observations={ flip(0) : heads, [...] flip(9): tails }, num_samples=10000, num_chains=1,)If we then did a histogram of the prior and the posterior of fairness given these observations, we'd discover that as the number of samples increased, the histograms would conform more and more closely to these graphs:
Prior: Beta(2,2)

Posterior if we got nine heads and one tail in the observations:

When we observe nine heads out of ten, we should update our beliefs about the fairness of the coin by quite a large amount.
I want to emphasize that what this analysis gives you is not just a point estimate - the peak of the distribution - but a real sense of how tight that estimate is. If we had to make a single guess as to the fairness of the coin prior to observations, our best guess would be 0.5. In the posterior our best guess would be around 0.83. But we get so much more information out of the distribution! We know from the graphs that the prior is extremely loose"; sure, 0.5 is our best guess, but 0.3 would be entirely reasonable. The posterior is much tighter. And as we observed more and more coin flips, that posterior would get even tighter around the true value of the fairness.
Notice also that the point estimate of the posterior is not 0.9 even though we saw nine heads out of ten! Our prior is that the coin is slightly more likely to be 0.8 fair than 0.9 fair, and that information is represented in the posterior distribution.
All right, that's enough recap. Next time on FAIC: I'm not going to go through all the tutorials on the web site showing how to use Bean Machine to build more complex models; see the web site for those details. Rather, I'm going to spend the rest of this series talking about my work as the compiler guy" on a team full of data scientists who understand the math much better than I do.