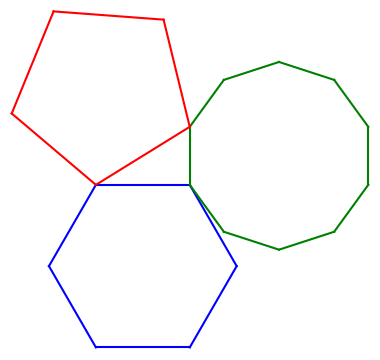
A pentagon, hexagon, and decagon walk into a bar …
The new book A Panoply of Polygons cites a theorem Euclid (Proposition XIII.10) saying
If a regular pentagon, a regular hexagon, and a regular decagon are inscribed in congruent circles, then their side lengths form a right triangle.
This isn't exactly what Euclid said, but it's an easy deduction from what he did say.
Here's an illustration.

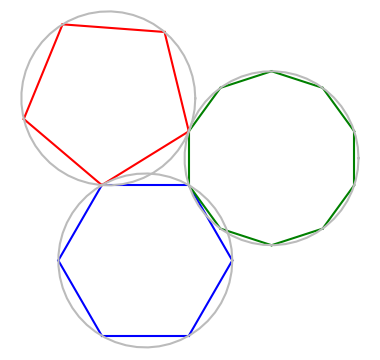
Update: Ralph Corderoy suggested in the comments that it would be good to add the congruent circles through the polygon vertices. Here is a graphic with the circles added.

I learned about this theorem from the book cited above, which arrived in the mail yesterday. The figure looked familiar because Cliff Pickover had posted essentially the same illustration on Twitter recently, saying that not only is there a right triangle in the middle of the diagram, this triangle is half of a golden rectangle.
The length of the side of a regular polygon with n sides is 2R sin(/n) where R is the radius of the circle through the vertices. So to prove that the ratio between the side of the hexagon and the side of the decagon is the golden ratio , it suffices to prove
sin(/6) / sin(/10) =
You could verify this in Mathematica by seeing that the following returns True.
Sin[Pi/6]/ Sin[Pi/10] == GoldenRatioPython code
Here's the code I used to create the image above.
from numpy import exp, pi, arange import matplotlib.pyplot as plt # Vertices of a hexagon hexa = exp(2j*pi*arange(6)/6) # Vertices of a decagon, shifted and rotated # to have a side perpendicular to the hexagon deca = exp(2j*pi*(0.5+arange(10))/10) deca += hexa[1] - deca[5] # Shift and rotate a pentagon to share one vertex # with the hexagon and one vertex with the decagon omega = exp(2j*pi/5) c = (hexa[2]*omega - deca[4])/(omega - 1) penta = c + (hexa[2] - c)*exp(2j*pi*arange(5)/5) def connect(p, q, c): plt.plot([p.real, q.real], [p.imag, q.imag], '-', color=c) plt.gca().set_aspect("equal") for n in range(-1, 5): connect(hexa[n], hexa[n+1], 'blue') for n in range(-1, 9): connect(deca[n], deca[n+1], 'green') for n in range(-1, 4): connect(penta[n], penta[n+1], 'red') plt.show()The ability to use -1 to as the index to the last element of an array simplifies the code that connects the vertices. In a language like C you'd have to write an extra statement after your loop to join the last vertex to the first.
When I first saw the illustration in Panoply of Pentagons I though that the top of the pentagon was parallel to the top of the hexagon. When I wrote the Python code first assuming this orientation of the pentagon, things didn't line up. Writing the code made me pay closer attention, as is often the case.
Related postsThe post A pentagon, hexagon, and decagon walk into a bar ... first appeared on John D. Cook.