A curious pattern in January exponential sums
The exponential sum page on this site draws a new image every day based on plugging the month, day, and year into a formula. Some of these images are visually appealing; I've had many people ask if they could use the images in publications or on coffee mugs etc.
The images generally look very different from one day to the next. One reason I include the date numbers in the order I do, using the American convention, is that this increases the variety from one day to the next.
If you first became aware of the page on New Years Day this year, you might think the page is broken because there was no apparent change between January 1 and January 2. Yesterday's image was different, but then today, January 4, the image looks just like the images for January 1st and 2nd. They all look like the image below.
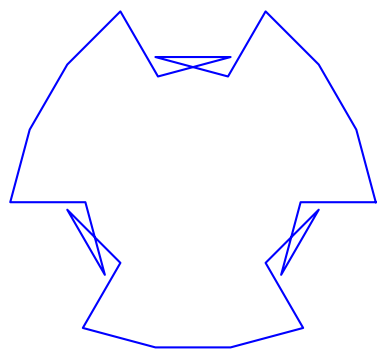
The plots produced on each day are distinct, but they are geometrically congruent.
The exponential sum page displays a plot connecting the partial sums of a certain series given here. The axes are turned off and so only the shape of the plot is displayed. If one plot is a translation or dilation of another, the images shown on the page will be the same.
Here's a plot of the images for January 1, 2, and 4, plotted red, green, and blue respectively.
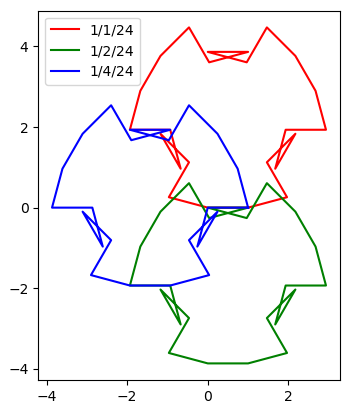
This shows that the images are not the same, but are apparently translations of each other.
There's another difference between the images. Connecting consecutive partial sums draws an image clockwise on January 1, but counterclockwise on January 2 and 4. You can see this by clicking on the animate" link on each page.
The post A curious pattern in January exponential sums first appeared on John D. Cook.