The simple part of the logistic map isn’t that simple
Five years ago I wrote a blog post entitled Logistic bifurcation diagram in detail. Looking back at that post it doesn't seem to be that much in detail," though it does go into more detail than most popular accounts.
The logistic map is given by
f(x) =rx(1 -x)
wherex is a variable between 0 and 1 andr is a parameter between 0 and 4.
If you look at what happens to values ofx as you repeatedly apply the logistic map, computingf(x),f(f(x)),f(f(f(x))), ..., things get interesting:
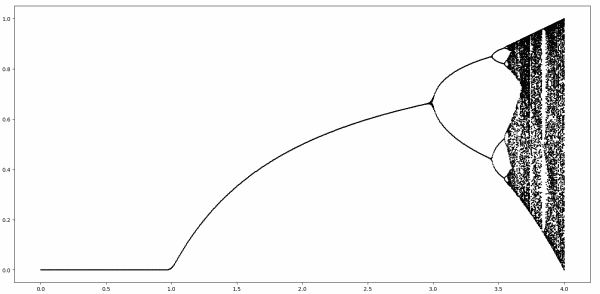
This plot shows where the iterations end up as the parameterr varies. Whenr 3 the iterates converge to a single fixed point, assuming you start strictly between 0 and 1. Whenr is a little bigger than 3 the iterates cycle between two attractor points, then for larger r they bounce between 4 points, then 8, then eventually chaos breaks out. Literally.
In the diagram above, it seems the region where 0 r 3 is the simple part. And it is, but it's notthat simple. This post will look a little deeper into what's happening in this part of the diagram.
Four questionsThere is a series of questions we can ask about the convergence of a sequence.
- Does the sequence converge?
- What does it converge to?
- How does it converge qualitatively?
- How rapidly does it converge?
We know that for 0 r 3 the iterates converge to a single point. So the answer to the first question is yes.
For 0 r 1 the iterates converge to 0. For 1 r 3 the iterates converge to (r - 1)/r. This answers the second question.
The third and fourth questions are more interesting.
Qualitative convergenceWhen 0 r < 1 the iterates decrease monotonically to 0.
When 1 r 2 the convergence is monotone. If x starts outbelow the fixed point (r - 1)/r then the convergence is monotone increasing. Ifx starts out above, the sequence is monotone decreasing.
When 2 < r 3 the convergence is not monotone; the iterates alternately overshoot and undershoot the fixed point once they get sufficiently close. This is because the derivative of f at the fixed point is negative.
Here is a cobweb plot showing that the convergence whenr = 2.9 is not monotone.
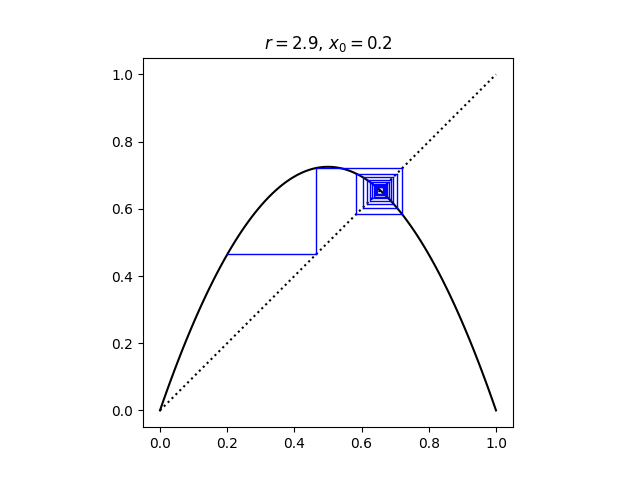
In a cobweb plot, monotone convergence looks like a staircase, and oscillating convergence looks like a spiral.
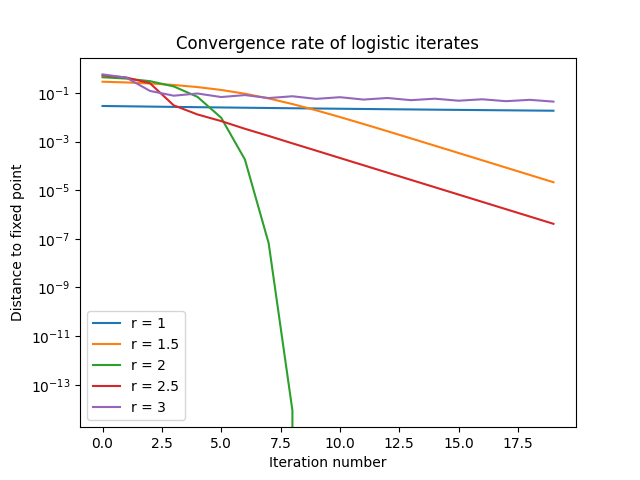
Speed of convergenceIn the region 0 < r < 1, convergence is like rn.
In the region 1 < r < 2, convergence is like (2 - r)n.
In the region 2 < r < 3, convergence is also like (2 - r)n, which now alternates sign.
The exceptional cases are r = 1, 2, and 3. Convergence is very slow for r = 1 and 3, and very fast for r = 2.
Whenr = 2, the distance to the fixed point squares at each step, so convergence is quadratic.