Quality metrics
by John from John D. Cook on (#70VK1)
Sometimes you'll hear that a process has so many nines of reliability or that the error rate is so many sigmas. A few years ago I wrote a post on converting between nines and sigmas. See that post for details, approximations, etc.
Here I'd like to post a new graph that I believe is an improvement on the graph in the original post.
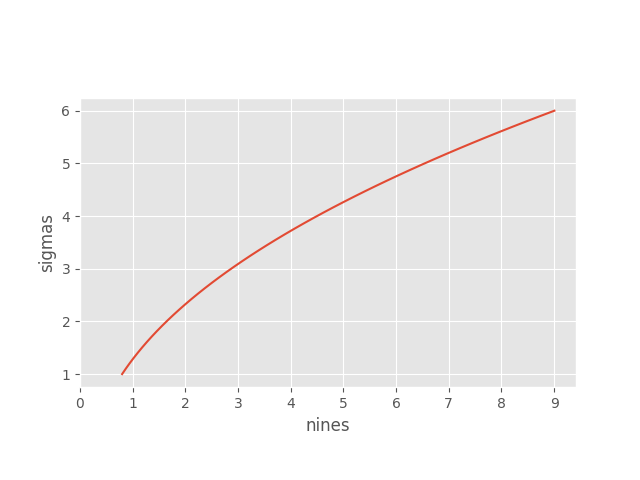
The grid lines make it easier to see how to convert between nines and sigmas. For example, 5 nines corresponds to a little more than 4 sigmas.
It's curious that 3 nines is approximately 3 sigmas, and 9 nines is very nearly 6 sigmas. There are no more points on the red curve with near integer coordinates until you go out to 72 nines, which is nearly 18 sigmas.
The post Quality metrics first appeared on John D. Cook.