Four maps show how electricity generation has changed in the US
by Megan Geuss from Ars Technica - All content on (#3ZCST)

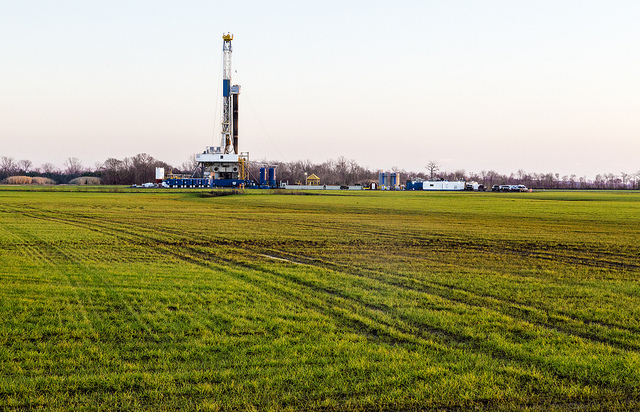
A natural gas fracking well near Shreveport, Louisiana. (credit: Daniel Foster)
The US Energy Information Agency (EIA) recently published two interesting sets of maps to show how the US energy mix has changed state by state between 2007 and 2017.
That decade saw the rise of cheap natural gas that lead many utilities to switch away from coal, but the result is not as clear-cut as one might think: in some states, coal retirements resulted in nuclear power becoming the most-used energy source.
It's also important to note that the maps below reflect electricity generation, not necessarily consumption. In some cases, what's generated within state lines will be sold to neighboring states.
Read 6 remaining paragraphs | Comments