New map shows vulnerability of Antarctic ice to self-fracking

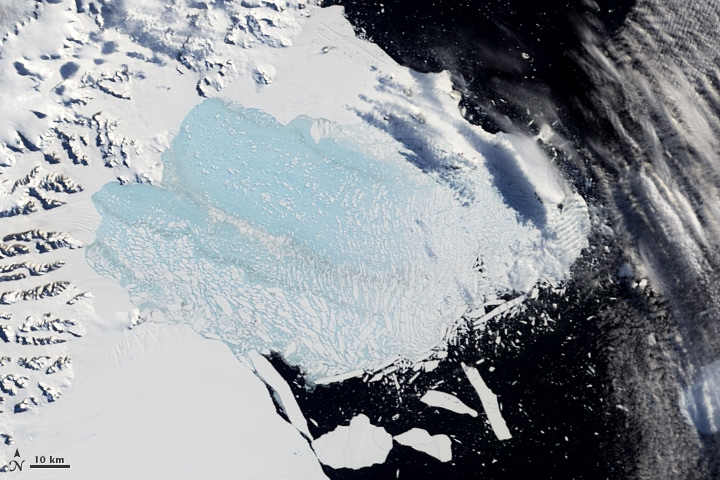
Enlarge / In 2002, the Larsen B ice shelf disintegrated in a matter of weeks. (credit: NASA EO)
In 2016, a study found that adding a couple new processes to a model of the Antarctic ice sheets made them much more vulnerable to melt, greatly increasing global sea level rise-both this century and in the centuries to come. It was an alarming result, to be sure, but also a bit conjectural. The researchers didn't have a way to assess how realistically the new processes were modeled, so they viewed their paper as raising a question deserving attention rather than providing an answer.
The new processes were the collapse of ice cliffs above a certain height (a theoretical constraint, but not something we've watched happen) and hydrofracturing. The latter is a propagation of a surface fracture in the ice clean through to the bottom of the ice sheet as the crack fills with water. Hydrofracturing is a known commodity-it was probably the dominant process in the sudden collapse of Antarctica's Larsen B ice shelf in 2002. The question here, instead, is how vulnerable is the rest of Antarctica to this process?
A new study led by Ching-Yao Lai at Columbia University's Lamont-Doherty Earth Observatory has tried to answer that question by mapping fractures and calculating where hydrofracturing should be possible.
Read 10 remaining paragraphs | Comments