Ranking Washington Transit Agencies by Service Hours. #2 Will Shock You.
Wikimedia. Forgive the clickbait headline, it's just for fun. :)
Earlier this month WSDOT came out with its annual Summary of Public Transportation, its comprehensive accounting of just how much transit service exists in Washington, how much it costs, and where the money comes from.
Of course, very little service is funded or provided directly by our state, ranking us near the bottom of "Blue States" in terms of the state's relative funding share. Instead, our patchwork of city agencies, county agencies, and special purpose tax districts combine to provide 9.7 million annual service hours to 5.9 million of Washington's 7 million people, meaning 84% of the state's population lives within an area paying some form of transit taxes. As transit is primarily an urban service, the combined ORCA agencies alone (excluding Washington State Ferries) provide 69% of the transit service hours in Washington. But how much does each person get? Which agencies provide the most service per capita?
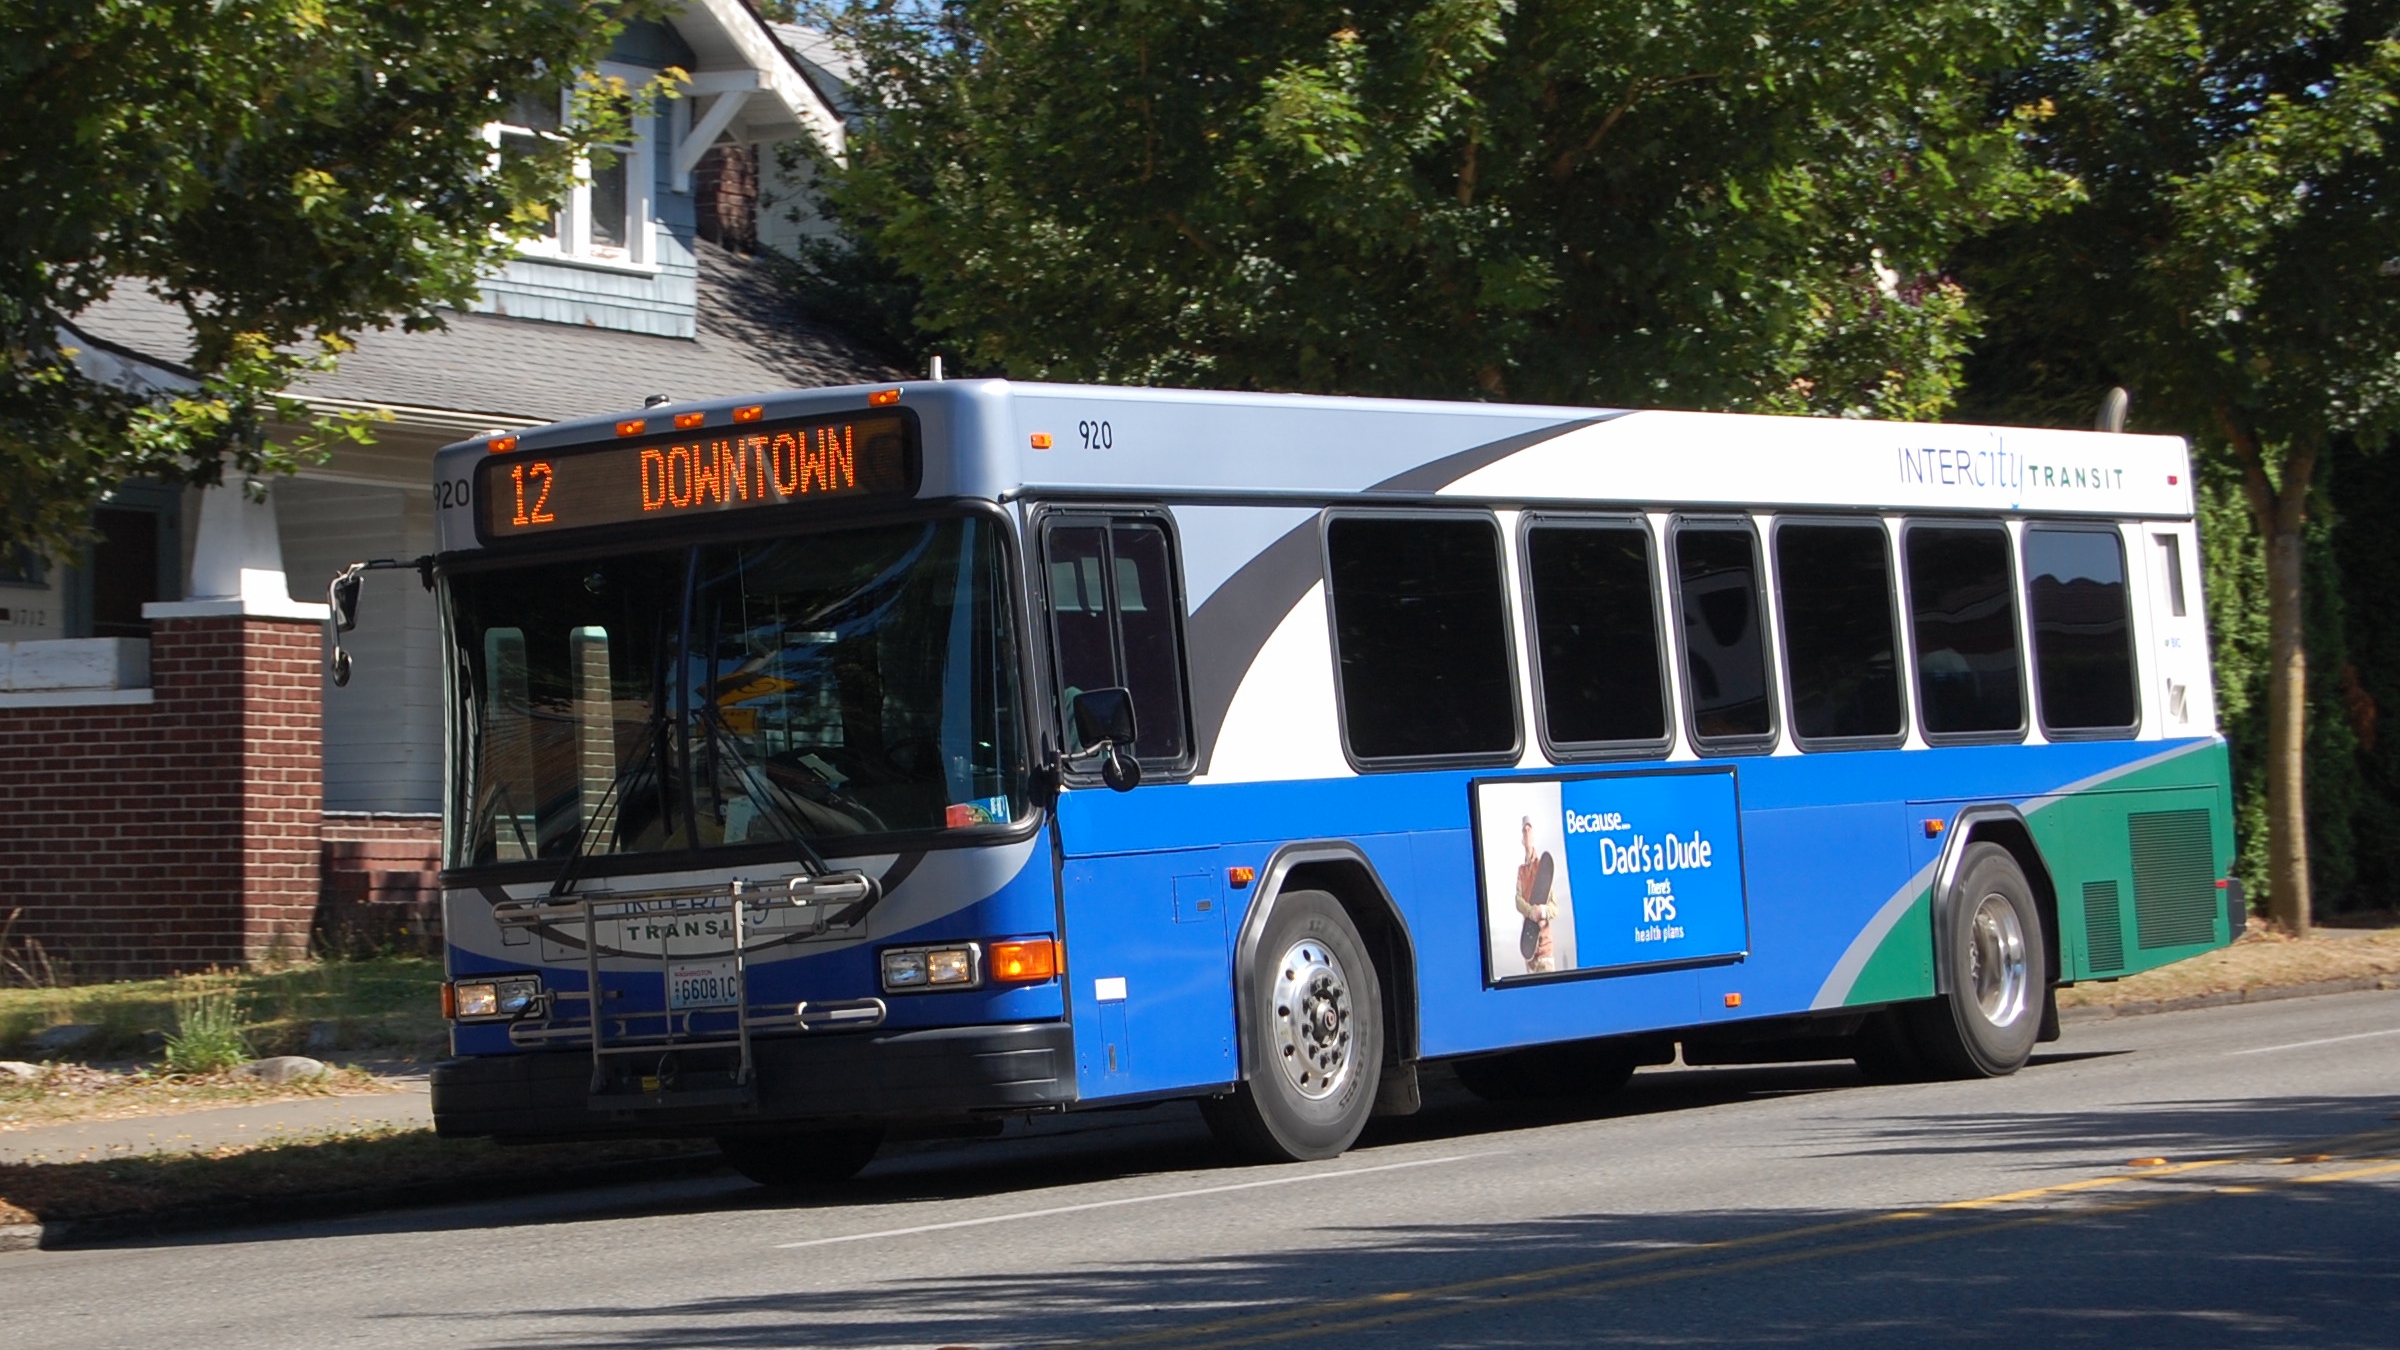
Now that I'm spending a few days a month in Yakima, I noticed that its transit network - mostly hourly circulators - is abysmal for a city of its size. But anecdotes aren't data, so I thought it'd be interesting to rank all of our state's agencies* by per capita service hours - inclusive of all fixed-route, flexible service, paratransit, and vanpool services - to see which ones punch above and below their relative weights in terms of total service provision (rankings below). The results are fascinating, with some small agencies providing high quality service levels (such as Intercity Transit and Spokane Transit), and others (Yakima C-Tran, etc), not doing so well.
Yet all metrics provide only partial insight, and "per capita service hours" is no different. The metric tells us how much is spent and nothing about productivity, and it privileges agencies with either tightly-drawn boundaries, a dense network, or both.
With its dense county-only network, King County Metro comes in first place at 2.12 service hours per capita. On the other end, with pre U-Link data, a tri-county network of "long and thin" express services, and its current emphasis on capital construction, Sound Transit comes in last place at just 0.23 service hours per capita. Is this damning for Sound Transit? Not at all. To see why, consider an analogy from global currencies.
If our tax dollars are the investment, then service hours are the currency through which dividends are paid. Among the agencies below, all of them except Sound Transit use the same unit of value, the good old bus. Using the same unit of value narrows the range of possible productivity outcomes. You may have 10 riders per service hour or you may have 50, but a bus is generally not going to have 1,000, so analyzing total service output allows for reasonably direct comparison.
Yet upgrading to high-capacity transit is like adopting a higher-value currency, in that a high-capacity service hour has vastly higher purchasing power. RapidRide D has Metro's highest ridership per platform hour (80). By contrast, Link is projected to have 240 riders per service hour in 2017, and 390 for Sounder. So as we increase passenger density, service hours per capita should fall, plunging Sound Transit to the bottom of the list. Within the bus world, it's better to be on top, and Metro and Intercity Transit are the cream of the crop. But our recent Yes vote on ST3 told lawmakers that we also want some of our reserves in higher-value currency, grade-separated light rail.
With those caveats in mind, here are Washington's 31 agencies ranked by service hours per capita.
*Community based providers (HopeLink, People for People, etc are not included below).
Agency | Sales Tax Rate (%) | 2015 Annual Service Hours | 2015 Service Area Population | 2015 Service Hours Per Capita |
| King County Metro | 0.9 | 4,320,000 | 2,040,000 | 2.12 |
Intercity Transit | 0.8 | 371,900 | 178,328 | 2.09 |
| Combined ORCA Agencies | Varies | 6,680,000 | 3,530,000 | 1.89 |
Ben Franklin Transit (Tri-Cities) | 0.6 | 362,800 | 251,151 | 1.44 |
| Spokane Transit Authority | 0.6 | 590,800 | 417,116 | 1.42 |
| Everett Transit | 0.6 | 147,717 | 105,800 | 1.39 |
Island Transit | 0.9 | 108,500 | 82,910 | 1.31 |
| Pierce Transit | 0.6 | 698,900 | 547,975 | 1.28 |
Clallam Transit | 0.6 | 90,772 | 72,650 | 1.25 |
| Skagit Transit | 0.4 | 126,200 | 109,306 | 1.15 |
Grays Harbor Transit | 0.7 | 77,500 | 71,078 | 1.09 |
| Community Transit | 0.9 (now 1.2) | 609,500 | 565,244 | 1.08 |
Twin Transit (Lewis County) | 0.2 | 26,000 | 24,290 | 1.07 |
| Pullman Transit | 0.0 (2% utility tax instead) | 33,995 | 32,110 | 1.06 |
Pacific Transit | 0.3 | 20,300 | 20,591 | 0.99 |
| Whatcom Transit | 0.6 | 203,400 | 212,357 | 0.96 |
Mason Transit | 0.6 | 57,900 | 60,497 | 0.96 |
| River Cities Transit (Cowlitz County) | 0.3 | 46,400 | 49,200 | 0.94 |
Kitsap Transit | 0.8 | 243,800 | 262,590 | 0.93 |
| C-Tran (Clark County) | 0.7 | 356,600 | 391,480 | 0.89 |
Link Transit (Wenatchee) | 0.4 | 98,700 | 111,063 | 0.89 |
| Jefferson Transit | 0.9 | 26,500 | 30,076 | 0.88 |
Yakima Transit | 0.3 | 90,800 | 106,675 | 0.85 |
| Valley Transit | 0.6 | 43,900 | 51,933 | 0.85 |
Selah Transit | 0.3 | 5,341 | 7,147 | 0.74 |
| Asotin County PTBA | 0.2 | 15,875 | 22,010 | 0.72 |
TranGo (Okanogan) | 0.4 | 26,159 | 38,991 | 0.67 |
Grant County | 0.2 | 39,856 | 93,930 | 0.43 |
| Sound Transit | 0.9 (soon 1.8) | 653,000 | 2,800,000 | 0.23 |
| OUTLIERS | ||||
Garfield County | 0.0 (Grants/ fares) | 3,293 | 855 | 3.85 |
| Columbia County | 0.4 | 12,213 | 4,090 | 2.99 |
Union Gap Transit | 0.2 | 16,400 | 6,037 | 2.71 |