Wearable biosensors can flag illness, Lyme disease, risk for diabetes; low airplane oxygen
by noreply@blogger.com (brian wang) from NextBigFuture.com on (#28PMW)
A new wave of wearable sensors allows frequent and continuous measurements of body functions (physiology), including heart rate, skin temperature, blood oxygen levels, and physical activity. We investigated the ability of wearable sensors to follow physiological changes that occur over the course of a day, during illness and other activities. Data from these sensors revealed personalized differences in daily patterns of activities. Interestingly, we discovered striking changes in particular environments such as airline flights. Blood oxygen levels decreased during high-altitude flights, and this decrease was associated with fatigue. By combining sensor information with frequent medical measurements, we made two important health-related observations. First, wearable sensors were useful in identifying the onset of Lyme disease and inflammation. From this observation, we then developed a computational algorithm for personalized disease detection using such sensors. Second, we found that wearable sensors can reveal physiological differences between insulin-sensitive and insulin-resistant individuals, raising the possibility that these sensors could help detect risk for type 2 diabetes. Overall, these results indicate that the information provided by wearable sensors is physiologically meaningful and actionable. Wearable sensors are likely to play an important role in managing health.
They investigated the use of these devices to monitor human physiological changes during various activities and their role in managing health and diagnosing and analyzing disease. By recording over 250,000 daily measurements for up to 43 individuals, they found personalized circadian differences in physiological parameters, replicating previous physiological findings. Interestingly, we found striking changes in particular environments, such as airline flights (decreased peripheral capillary oxygen saturation [SpO2] and increased radiation exposure). These events are associated with physiological macro-phenotypes such as fatigue, providing a strong association between reduced pressure/oxygen and fatigue on high-altitude flights. Importantly, we combined biosensor information with frequent medical measurements and made two important observations: First, wearable devices were useful in identification of early signs of Lyme disease and inflammatory responses; we used this information to develop a personalized, activity-based normalization framework to identify abnormal physiological signals from longitudinal data for facile disease detection. Second, wearables distinguish physiological differences between insulin-sensitive and -resistant individuals. Overall, these results indicate that portable biosensors provide useful information for monitoring personal activities and physiology and are likely to play an important role in managing health and enabling affordable health care access to groups traditionally limited by socioeconomic class or remote geography.

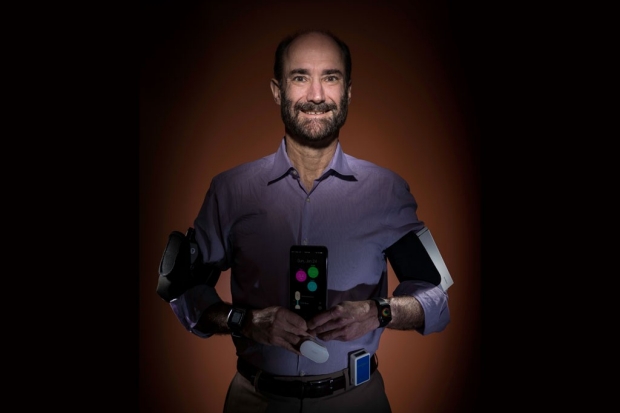
Geneticist Michael Snyder was wearing seven biosensors collecting data about his health when he noticed changes in his heart rate and oxygen level during a flight. When he later developed a fever, he suspected he had been infected with Lyme disease. Subsequent tests confirmed his suspicion.
Steve Fisch
the team collected nearly 2 billion measurements from 60 people, including continuous data from each participant's wearable biosensor devices and periodic data from laboratory tests of their blood chemistry, gene expression and other measures. Participants wore between one and seven commercially available activity monitors and other monitors that collected more than 250,000 measurements a day. The team collected data on weight; heart rate; oxygen in the blood; skin temperature; activity, including sleep, steps, walking, biking and running; calories expended; acceleration; and even exposure to gamma rays and X-rays.
"I was very impressed with all the data that was collected," said Eric Topol, MD, professor of genomics at the Scripps Research Institute, who was not involved in the study. "There's a lot here - a lot of sensors and a lot of different data on each person."
The study demonstrated that, given a baseline range of values for each person, it is possible to monitor deviations from normal and associate those deviations with environmental conditions, illness or other factors that affect health. Distinctive patterns of deviation from normal seem to correlate with particular health problems. Algorithms designed to pick up on these patterns of change could potentially contribute to clinical diagnostics and research.
The work is an example of Stanford Medicine's focus on precision health, whose goal is to anticipate and prevent disease in the healthy and to precisely diagnose and treat disease in the ill.
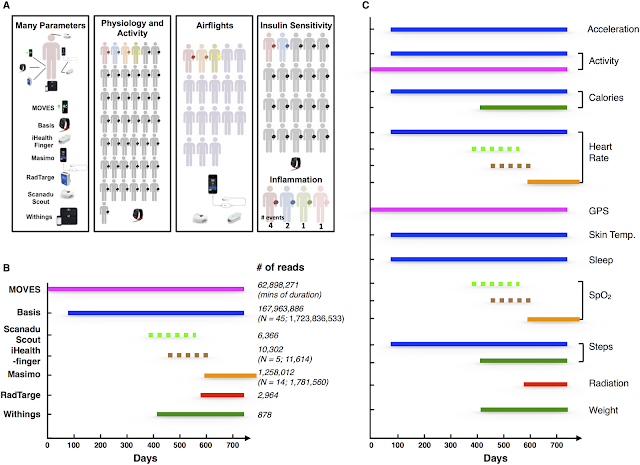
 Overview of the project and summary of the devices.
(A) Wearable devices used in this study. The different colors for the human figures indicate the specific studies in which each individual participated (i.e., red participated in all five studies, grey in two studies [Physiology/Activity and Insulin Sensitivity], blue in three studies [Physiology/Activity, Insulin Sensitivity, and Inflammation], orange and yellow in two studies [Physiology/Activity and Airflights], and green and pink in one study [Inflammation] and purple in one study [Airflights]). (B) The period during which the devices were used. The number of data points available for Participant #1 and others is indicated to the right. (C) The specific parameters measured by the different devices. The devices used to measure these parameters were represented by the color of the lines (MOVES: magenta; Basis: dark blue; Scanadu Scout: light green; iHealth-finger: brown; Masimo: orange; RadTarge: red; Withings: dark green). Dashed line indicates devices used frequently for discrete measurements; solid lines indicate devices that provide continuous measurement.
Digital Health: Tracking Physiomes and Activity Using Wearable Biosensors Reveals Useful Health-Related Information
Read more


They investigated the use of these devices to monitor human physiological changes during various activities and their role in managing health and diagnosing and analyzing disease. By recording over 250,000 daily measurements for up to 43 individuals, they found personalized circadian differences in physiological parameters, replicating previous physiological findings. Interestingly, we found striking changes in particular environments, such as airline flights (decreased peripheral capillary oxygen saturation [SpO2] and increased radiation exposure). These events are associated with physiological macro-phenotypes such as fatigue, providing a strong association between reduced pressure/oxygen and fatigue on high-altitude flights. Importantly, we combined biosensor information with frequent medical measurements and made two important observations: First, wearable devices were useful in identification of early signs of Lyme disease and inflammatory responses; we used this information to develop a personalized, activity-based normalization framework to identify abnormal physiological signals from longitudinal data for facile disease detection. Second, wearables distinguish physiological differences between insulin-sensitive and -resistant individuals. Overall, these results indicate that portable biosensors provide useful information for monitoring personal activities and physiology and are likely to play an important role in managing health and enabling affordable health care access to groups traditionally limited by socioeconomic class or remote geography.

Geneticist Michael Snyder was wearing seven biosensors collecting data about his health when he noticed changes in his heart rate and oxygen level during a flight. When he later developed a fever, he suspected he had been infected with Lyme disease. Subsequent tests confirmed his suspicion.
Steve Fisch
the team collected nearly 2 billion measurements from 60 people, including continuous data from each participant's wearable biosensor devices and periodic data from laboratory tests of their blood chemistry, gene expression and other measures. Participants wore between one and seven commercially available activity monitors and other monitors that collected more than 250,000 measurements a day. The team collected data on weight; heart rate; oxygen in the blood; skin temperature; activity, including sleep, steps, walking, biking and running; calories expended; acceleration; and even exposure to gamma rays and X-rays.
"I was very impressed with all the data that was collected," said Eric Topol, MD, professor of genomics at the Scripps Research Institute, who was not involved in the study. "There's a lot here - a lot of sensors and a lot of different data on each person."
The study demonstrated that, given a baseline range of values for each person, it is possible to monitor deviations from normal and associate those deviations with environmental conditions, illness or other factors that affect health. Distinctive patterns of deviation from normal seem to correlate with particular health problems. Algorithms designed to pick up on these patterns of change could potentially contribute to clinical diagnostics and research.
The work is an example of Stanford Medicine's focus on precision health, whose goal is to anticipate and prevent disease in the healthy and to precisely diagnose and treat disease in the ill.
(A) Wearable devices used in this study. The different colors for the human figures indicate the specific studies in which each individual participated (i.e., red participated in all five studies, grey in two studies [Physiology/Activity and Insulin Sensitivity], blue in three studies [Physiology/Activity, Insulin Sensitivity, and Inflammation], orange and yellow in two studies [Physiology/Activity and Airflights], and green and pink in one study [Inflammation] and purple in one study [Airflights]). (B) The period during which the devices were used. The number of data points available for Participant #1 and others is indicated to the right. (C) The specific parameters measured by the different devices. The devices used to measure these parameters were represented by the color of the lines (MOVES: magenta; Basis: dark blue; Scanadu Scout: light green; iHealth-finger: brown; Masimo: orange; RadTarge: red; Withings: dark green). Dashed line indicates devices used frequently for discrete measurements; solid lines indicate devices that provide continuous measurement.
Digital Health: Tracking Physiomes and Activity Using Wearable Biosensors Reveals Useful Health-Related Information
Read more