The new abnormal is warming up the US government’s new climate norms

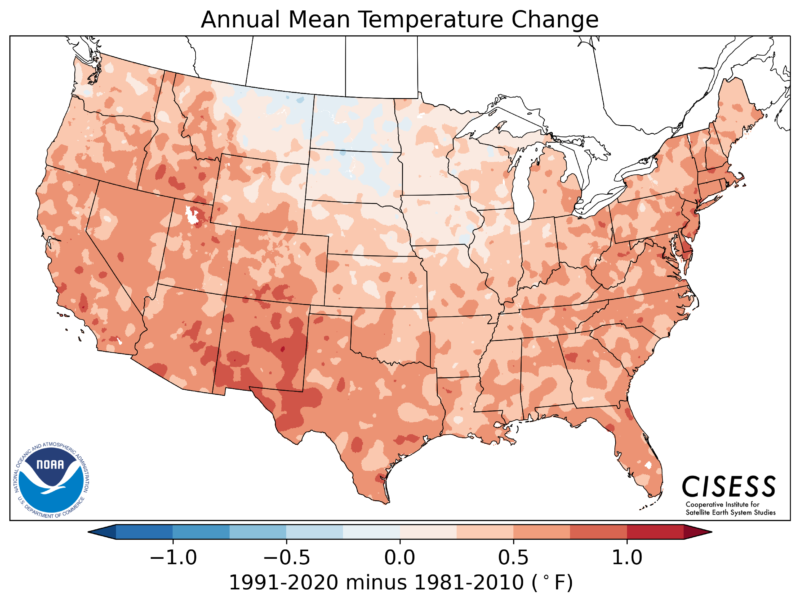
Enlarge / What a difference a decade makes. Even though 2/3 of the data in the new normals is present in the previous ones, the last decade's still been hot enough to drag the temperatures upwards. (credit: NOAA)
On Tuesday, the National Oceanic and Atmospheric Administration (NOAA) released a set of data it terms the "US Climate Normals." Updated once a decade, the figures contained in the report are based on the past 30 years of weather records, and they provide a sense of what the typical weather is on a given day of the year in each of the US's states and territories.
As you might imagine given the recent global temperature records, these figures show widespread warming compared to the normals of even a decade ago. They also reveal that while much of the US is getting wetter with the changing climate, California and the Southwest are in the midst of a dramatic drying trend.
What's normal, anyway?As NOAA puts it, you're most likely to come across its climate normals on a weather forecast when the projected conditions are compared to the ones typical for that location and time of year. The normals provide information on what's typical.
Read 9 remaining paragraphs | Comments