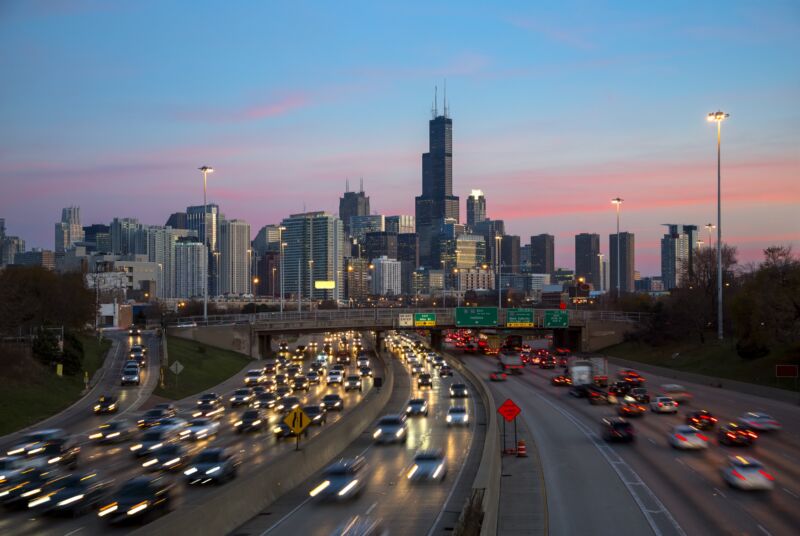
Here’s where traffic sucked the most in 2022

Enlarge (credit: Getty Images)
Did your commute get worse in 2022? Overall, congestion cost the country more than $81 billion, says transportation data company Inrix. It just published its Global Traffic Scorecard for the past year, and the data says the typical US driver spent 51 hours in traffic last year, 15 hours more than in 2021. And due to increased fuel prices and other inflation, the average driver paid $134 more for fuel last year than the year before-and that's in addition to $869 in lost time.
Although it's not as severe as it was in 2020 or 2021, it's still possible to see the effect of the pandemic in Inrix's data. In the US, vehicle miles traveled (VMT) increased by 1 percent year on year, but we still drove 9 percent fewer miles per year than before the pandemic. Interestingly, Inrix says this is due to more people continuing to work from home, which it says now accounts for 17.9 percent of Americans-before the pandemic, work from home accounted for only 5.7 percent of workers, according to the US Census Bureau.
Sadly, road safety is still rather abysmal; the estimated fatality rate of 1.27 deaths per 100 million VMT is 17 percent higher than we saw in 2019, although there has been a slight reduction from 2021's high of 1.3 fatalities per 100 million VMT. And while some of the other trends found in the report exist in countries like the UK or Germany, the rise in road deaths appears to be unique to the US.